
College Algebra
7th Edition
ISBN:9781305115545
Author:James Stewart, Lothar Redlin, Saleem Watson
Publisher:James Stewart, Lothar Redlin, Saleem Watson
Chapter3: Polynomial And Rational Functions
Section3.1: Quadratic Functions And Models
Problem 2E: The quadratic function f(x)=a(xh)2+k is in standard form. (a) The graph of f is a parabola with...

Related questions
Question
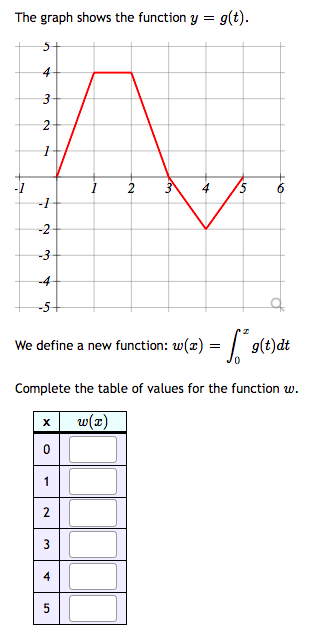
Transcribed Image Text:The graph shows the function y = g(t).
4
3
2
-1
-2
-4
-5+
We define a new function: w(x) = | g(t)dt
Complete the table of values for the function w.
w(x)
2.
4
3.
3.
Expert Solution
This question has been solved!
Explore an expertly crafted, step-by-step solution for a thorough understanding of key concepts.

Step by step
Solved in 2 steps with 2 images

Recommended textbooks for you
College Algebra
Algebra
ISBN:
9781305115545
Author:
James Stewart, Lothar Redlin, Saleem Watson
Publisher:
Cengage Learning

Algebra & Trigonometry with Analytic Geometry
Algebra
ISBN:
9781133382119
Author:
Swokowski
Publisher:
Cengage
College Algebra
Algebra
ISBN:
9781305115545
Author:
James Stewart, Lothar Redlin, Saleem Watson
Publisher:
Cengage Learning
Algebra & Trigonometry with Analytic Geometry
Algebra
ISBN:
9781133382119
Author:
Swokowski
Publisher:
Cengage