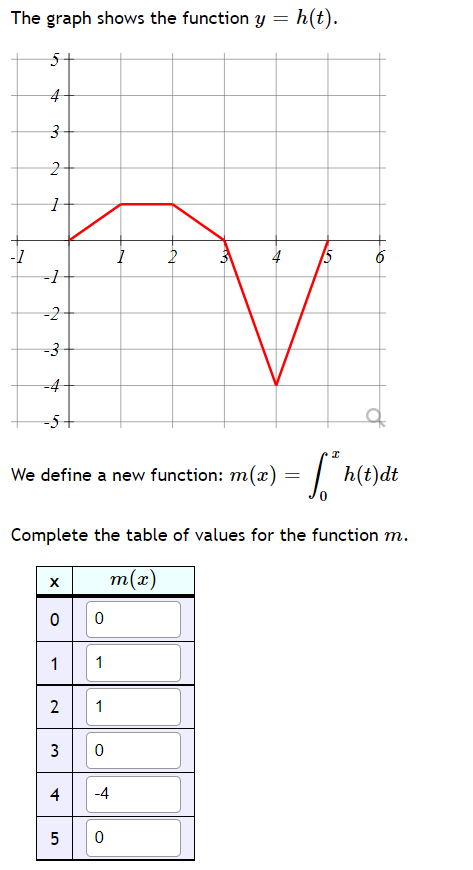
The graph shows the function y = h(t). -1 -2 -3 -4 We define a new function: m(x) = | h(t)dt Complete the table of values for the function m. to
The graph shows the function y = h(t). -1 -2 -3 -4 We define a new function: m(x) = | h(t)dt Complete the table of values for the function m. to

Algebra & Trigonometry with Analytic Geometry
13th Edition
ISBN:9781133382119
Author:Swokowski
Publisher:Swokowski
Chapter5: Inverse, Exponential, And Logarithmic Functions
Section5.2: Exponential Functions
Problem 31E

Related questions
Question
Transcribed Image Text:The graph shows the function y
h(t).
4
-1
4
15
-3
-4
-5
of
We define a new function: m(x) =| h(t)dt
Complete the table of values for the function m.
т(х)
X
1
1
2
1
4
-4
5
5.
2.
3.
Expert Solution
This question has been solved!
Explore an expertly crafted, step-by-step solution for a thorough understanding of key concepts.

This is a popular solution!

Trending now
This is a popular solution!

Step by step
Solved in 2 steps with 2 images

Recommended textbooks for you
Algebra & Trigonometry with Analytic Geometry
Algebra
ISBN:
9781133382119
Author:
Swokowski
Publisher:
Cengage
Algebra & Trigonometry with Analytic Geometry
Algebra
ISBN:
9781133382119
Author:
Swokowski
Publisher:
Cengage