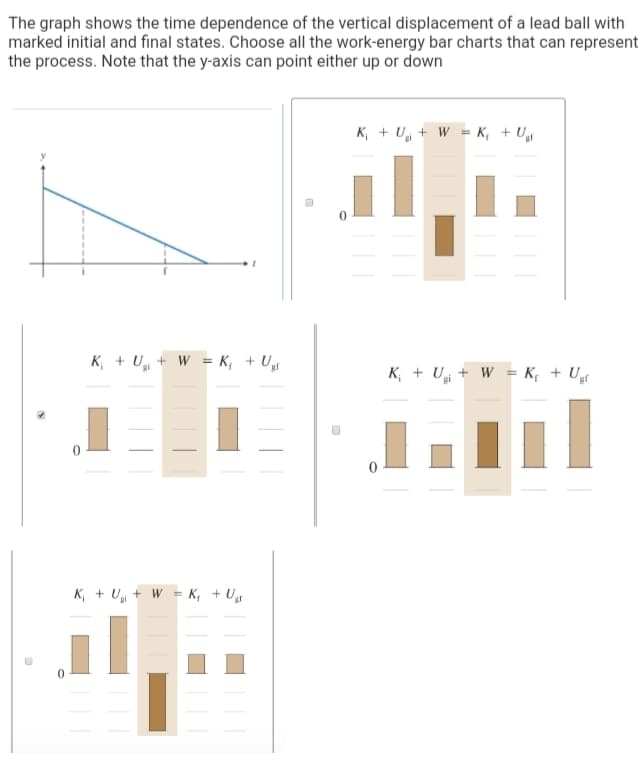
The graph shows the time dependence of the vertical displacement of a lead ball with marked initial and final states. Choose all the work-energy bar charts that can represent the process. Note that the y-axis can point either up or down
The graph shows the time dependence of the vertical displacement of a lead ball with marked initial and final states. Choose all the work-energy bar charts that can represent the process. Note that the y-axis can point either up or down

Related questions
Question
Transcribed Image Text:The graph shows the time dependence of the vertical displacement of a lead ball with
marked initial and final states. Choose all the work-energy bar charts that can represent
the process. Note that the y-axis can point either up or down
K, + Ug + W = K, + U
K, + U + W = K, + Ug
K; + Ug + W = K; + U
K + U + W = K, + U
Expert Solution
Step 1
Given : A graph of vertical displacement (y) versus time (t).
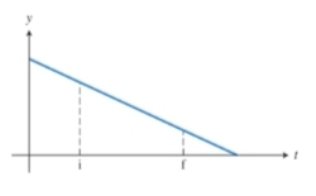
The slope of a displacement-time graph gives the velocity of the object. And from the given graph we can see that the object is in uniform motion, i.e., the slope of the graph is a constant. Which the velocity of the object is also a constant.

Trending now
This is a popular solution!

Step by step
Solved in 4 steps with 5 images
