The graphs below are for a spring-mass system. The same mass & spring were used for each graph. Fill in the table below the graphs. pos (m) 0.8 0.7 0.6 POSITION vs. TIME GRAPH #1 0.5 5 10 15 20 25 30 35 40 45 50 time uncertainty = 14 st X uncertainty of average period = 2.8 s Graph #1 Graph #2 Graph #3 Amplitude (m) X 18 x 8 14 to (s) X t (s) 48 45 pos (m) 0.8 0.7 0.6 0.5 POSITION vs. TIME GRAPH #2 t10 (s) M^^^^ˇˇˇˇˇˇˇˇ LA 5 10 15 20 25 30 35 40 45 50 uncertainty of average period time uncertainty 5 x Your answer is too high. 46 At for 10 cycles (s) 40 t (s) average T (s) pos (m) 0.8 0.7 0.6 POSITION vs. TIME GRAPH #3 0.5 5 10 15 20 25 30 35 40 45 50 Presumably, the average periods that you calculated are, within uncertainties, the same. This verifies that the period is independent of the amplitude. t (s)
The graphs below are for a spring-mass system. The same mass & spring were used for each graph. Fill in the table below the graphs. pos (m) 0.8 0.7 0.6 POSITION vs. TIME GRAPH #1 0.5 5 10 15 20 25 30 35 40 45 50 time uncertainty = 14 st X uncertainty of average period = 2.8 s Graph #1 Graph #2 Graph #3 Amplitude (m) X 18 x 8 14 to (s) X t (s) 48 45 pos (m) 0.8 0.7 0.6 0.5 POSITION vs. TIME GRAPH #2 t10 (s) M^^^^ˇˇˇˇˇˇˇˇ LA 5 10 15 20 25 30 35 40 45 50 uncertainty of average period time uncertainty 5 x Your answer is too high. 46 At for 10 cycles (s) 40 t (s) average T (s) pos (m) 0.8 0.7 0.6 POSITION vs. TIME GRAPH #3 0.5 5 10 15 20 25 30 35 40 45 50 Presumably, the average periods that you calculated are, within uncertainties, the same. This verifies that the period is independent of the amplitude. t (s)

Related questions
Question
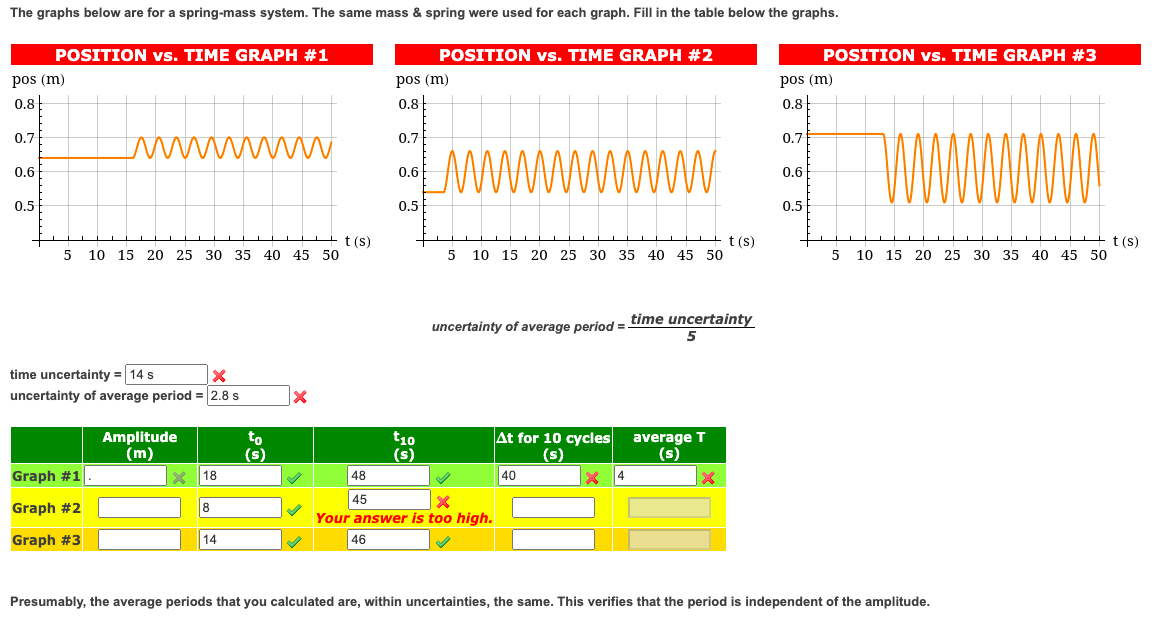
The graphs below are for a spring-mass system. The same mass & spring were used for each graph. Fill in the table below the graphs.
uncertainty of average period = time uncertainty/ 5
Transcribed Image Text:The graphs below are for a spring-mass system. The same mass & spring were used for each graph. Fill in the table below the graphs.
pos (m)
0.8
0.7
0.6
POSITION vs. TIME GRAPH #1
0.5
5 10 15 20 25 30 35 40 45 50
time uncertainty = 14 s
X
uncertainty of average period = 2.8 s
Graph #1
Graph #2
Graph #3
Amplitude
(m)
X 18
8
14
to
(s)
X
t(s)
48
45
pos (m)
0.8
0.7
0.6
0.5
POSITION vs. TIME GRAPH #2
t10
(s)
LAN
5 10 15 20 25 30 35 40 45 50
X
Your answer is too high.
46
www
uncertainty of average period = time uncertainty
5
At for 10 cycles
(s)
40
X 4
average T
(s)
t(s)
X
pos (m)
0.8
0.7
0.6
POSITION vs. TIME GRAPH #3
0.5
5 10 15 20 25 30 35 40 45 50
Presumably, the average periods that you calculated are, within uncertainties, the same. This verifies that the period is independent of the amplitude.
t(s)
Expert Solution
This question has been solved!
Explore an expertly crafted, step-by-step solution for a thorough understanding of key concepts.

Step by step
Solved in 2 steps
