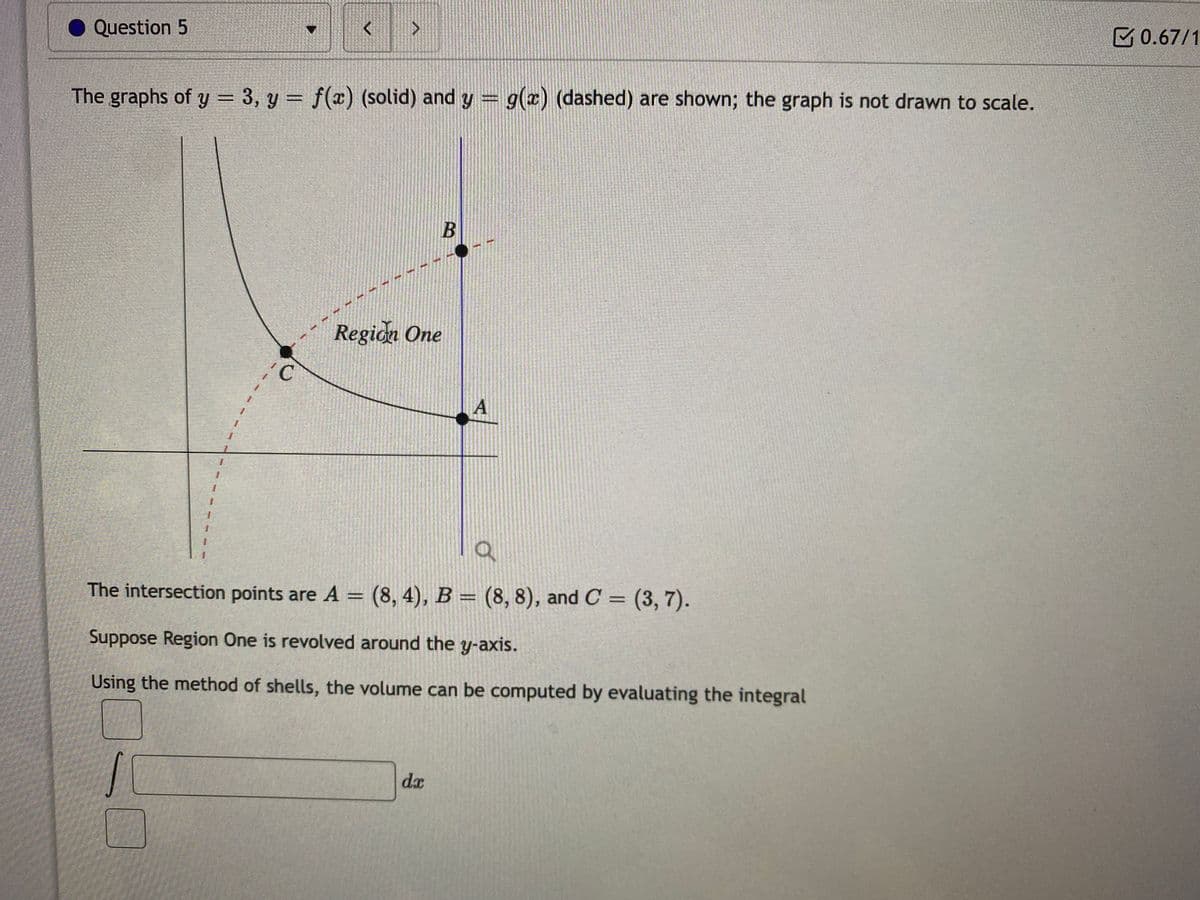
The graphs of y = 3, y = f(x) (solid) and y = g(x) (dashed) are shown; the graph is not drawn to scale. %3D Regidn One A
Q: ne color-coded graph of displacement s(t), velocity v(t), and acceleration a(t) (0,0) (8,0) 10 (8,…
A: Ans:- average velocity = 0 m/s For finding average velocity we have to considered only displacement…
Q: The atmospheric pressure decreases with increasing altitude. At sea level, the average air pressure…
A:
Q: The graph below gives the velocity of an object, v(t). Use the graph to answer the following…
A:
Q: The accompanying figure shows the graph of the height h in centimeters versus age t in years of an…
A: From the given graph, the coordinates would be h(5)=110, h(0)=50, h(10)=140, h(15)=175, h(20)=170…
Q: Weight loss Jared Fogle, also known as the “Subway SandwichGuy,” weighed 425 lb in 1997 before…
A: The rate of change is the speed at which a variable changes upon a particular period of time, which…
Q: Earthquakes: The scatterplot below was produced to investigate whether, for the period of…
A: Given : The scatterplot was produced to investigate whether, for the period of observation, the data…
Q: The graph below qives the velocity of an object, v(t). Use the graph to answer the following…
A:
Q: The process reaction curve of a temperature control system gives the value of: I K=6.8 T= 2.5…
A:
Q: 2. For the graph below, assume that any differences are significant (DV = test scores): 80
A: Main effect is the study of effect of one independent variable on dependent variable. Interaction…
Q: Use the graph to answer the following questions. Answers have a 5% tolerance to allow for…
A:
Q: The desert temperature, H, oscillates daily between 41 °F at 4am and 81 °F at 4pm. Write a possible…
A:
Q: 200 150 100 50 5 10 15 20 Age t (years) Height h (cm)
A: The age and height graph. We have to find the growth rate at each age.
Q: Use the approximation method shown in class for this question. If income doubles in 17.5 years, what…
A: If income double in 17.5 years. It means growth by 100% in 17.5 years.
Q: (b) Repeat part (a) using left endpoints. (Round your answer to four decimal places.) Sketch the…
A:
Q: We recommend using the Desmos graphing calculator. Answers have 5% tolerance. Assume data fits a…
A:
Q: The ordered pairs below give the intensities y in microwatts per square centimeter of the light…
A: Consider the given model: y=171.33x2 The ordered pairs below give the intensities y in microwatts…
Q: Here is a hypothetical but somewhat realistic graph on blood concentration of a medicine…
A: As we draw a horizontal line parallel to time axis at t=12 hours( as mentioned) Than it meets…
Q: A population of bacteria is growing according to the equation P(t)=1750e0.03tP(t)=1750e0.03t. Use a…
A:
Q: The immigration to the United States from Europe, as a percent of the total immigration, is…
A:
Q: Biologists conducted a study to investigate the flying velocity of mosquitoes both before and after…
A: We call a data point in a scatter plot as unusual if it is positioned far away from remaining of the…
Q: YA 10 B. A' B' X Was this an enlargement or reduction in size? The pre-image ABC was dilated by a…
A: We are given the following graph.
Q: Extrapolate! We recommend using the Desmos graphing calculator. Answers have 5% tolerance. Assume…
A: Let's plot the points A(10,38.8), B(15,58.2) and C(18,69.8).
Q: Refer to the graph above and without making any computations find: The average rate of change over…
A:
Q: My phone's battery usage shows the graph shown to the right. A. What is the phone's initial charge…
A:
Q: Find an equation for and sketch the graph of the level curve of the function f(x,y) that passes…
A:
Q: Using the graphs below, determine which curve has the greatest initial population. Which one is it?…
A:
Q: Use the figure to answer the questions y E Г В (a) At each labeled point on the graph, identify…
A: a) At A the graph is moving downwards so there instantaneous rate of change is negative. At B the…
Q: A vat of industrial waste, known colloquially as "Ooze", recently spilled into Turtle Pond.…
A:
Q: The graph of L(t) represents the average length (in mm) of the middle talon on an Indian spotted owl…
A: From the graph, we get the point (1.5, 4.5). This means L(1.5)=4.5 Physical meaning: 4.5 mm is the…
Q: Extrapolate! We recommend using the Desmos graphing calculator. Answers have 5% tolerance. Assume…
A: The value of y is 20.1
Q: 600
A: Given: y=6001+199e-0.5t To find: How many were infected initially (t=0) and the end of 7 days
Q: 50000 D(p) : 1+p e profit function associated with this product? (This is like
A: In this question, the concept of maxima and minima is applied. Maxima and Minima The extrema of a…
Q: A thin sheet of ice is in the form of a circle. If the ice is melting, at what rate is the radius…
A:
Q: A weather station recorded the amount of rain that fell during an 8-hour time frame using a rain…
A: We are given the following information. Let us first find the rate between 0 and 1, 1 and 4, 4 and…
Q: (b) Repeat part (a) using left endpoints. (Round your answer to four decimal places.) Sketch the…
A:
Q: In simple linear regression: a. The size of the coefficient for each IV gives you the size of the…
A: Linear regression is a linear relationship between one dependent variable and one independent…
Q: You have the supplies listed below how many smoothies can you make and EXPLAIN what is your limiting…
A:
Q: A. What is on the x and y axis of this graph? Describe in everyday words the meaning of the variable…
A: A) y-axis => Radiative flux x-axis => Wavelength Radiative flux is the measure of the…
Q: The line graph to the right indicates that in 1960, 23% of taxes came from corporate income tax. For…
A: We can make a linear function to solve the given question
Q: The graphs in the accompanying figure show the position s, velocity v = ds/dt, and acceleration a =…
A:
Q: . The graphs in the accompanying figure show the position s, velocity v = ds/dt, and acceleration a…
A:
Q: Extrapolate! We recommend using the Desmos graphing calculator. Answers have 5% tolerance. Assume…
A: topic - exponential function answe is 7.3
Q: Pacific Gas & Electric 2. With data taken from the World Health Organization (WHO) website, the…
A:
Q: During a snowstorm, snow fell at a constant rate for a number of hours. Then it stopped snowing for…
A: To find the rate, we have to find the slope of the curve from t = 0 to 4. Let y = snow on the…
Q: 1. Consider the data plotted in the coordinate plane. What do you notice about the y-values as x-…
A: Given graph is :
Q: A swimming pool is being filled. The graph shows the number of gallons y in the pool after x…
A: A swimming pool is being filled. The graph below shows the number of gallons y in the pool after x…
Q: a) Express the mathematical function between the variables h and r shown in the figure. b) How fast…
A: The water drains from the conical tank at a rate of 0.2 m3 per minute. Let consider at any instant…
Q: Prices of diamonds are determined by what is known as the 4 Cs: cut, clarity, color, and carat…
A: To test if there is a difference between the average standardized prices of 0.99 and 1 carat…
Trending now
This is a popular solution!
Step by step
Solved in 2 steps with 2 images
- Consider diffusion and reaction in a layer of soil. The problem is governed by the following equation and boundary conditions. Solve the problem using both boundary conditions at z=L using the characteristic equation in the form of exponentials and in the form of hyperbolic functions. Plot the solutions for D/kL = 0.1,1,and 10.Consider the graph of y2 = (1/12)x(4 − x)2 shown in the figure. Find the area of the surface formed when the loop of this graph is revolved about the x-axis.- Find by integration the area of the triangle having vertices at (5, 1), (1, 3), and (-1,-2). - Find by integration the area of the triangle having vertices at (3, 4), (2, 0), and (0, 1). - Find the area of the region bounded by the curve x³ x² + 2xy - y² = 0 and the line x = 4. (HINT: Solve the cubic equation for y in terms of x, and express y as two functions of x.) Find the area of the region bounded by the three curves y = x², x = y³, and x + y = 2. Find the area of the region bounded by the three curves y = x², y = 8 - x², and 4x - y + 12 = 0.
- x(t) is the average size of trees y(t) is the energy reserve x' = x(1-(x/y)) y' = ay(1-y)-b/x a) Consider two qulitatively different scenarios: b is small and b is large. Show that there are two fixed points for small b and no fixed points for large b. Sketh nullclines for these two different scenarios. What type of bifurcation occurs between these scenarios? b) Sketch phase portraits for these two difference scenarios and discuss the fate of the forest. c) Think about varying a and determine the bifurcationA normal is drawn to the hyperbola x^2/a^2+y^2/b^2=1 meets the transverse axis at G. If perpendicular from G onthe asymptote meets it at L, then show that LP is parallel toconjugate axis.J 1 A model summary of the same model (4c) is given below what conclusion can you drawn from these results
- When recording live performances, sound engineers often use a microphone with a cardioid pickup pattern because it suppresses noise from the audience. Suppose the microphone is placed 6m from the front of the stage and the boundary of the optimal pickup region is given by the given cardioid r=12+12sin(theta), where r is measured in meters and the microphone is at the pole. The musicians want to know the area they will have on the stage within the optimal pick up range of the microphone.5. Find the area bounded by the parabolas y2=4x and y2+12x=36 6. Find the area bounded by the curve y=4x-x2and the lines x=-2 and y=4 7. Find the area bounded by the functions y=3x-x3and line y=2 8. Find the area in the first quadrant bounded by the curve x2y=a3and the lines x=2a, y=4a, and the axes.Given a parabola with equation y = ax^2 where a is a constant, determine the value of a for which the centroid of the region bounded by this parabola, the x-axis, and the lines x = 1 and x = 2 coincides with the origin.