The histogram Height for 355 students. Frequency 40- 30- 20- 10-

Glencoe Algebra 1, Student Edition, 9780079039897, 0079039898, 2018
18th Edition
ISBN:9780079039897
Author:Carter
Publisher:Carter
Chapter10: Statistics
Section10.5: Comparing Sets Of Data
Problem 14PPS

Related questions
Question
Please only typing answer
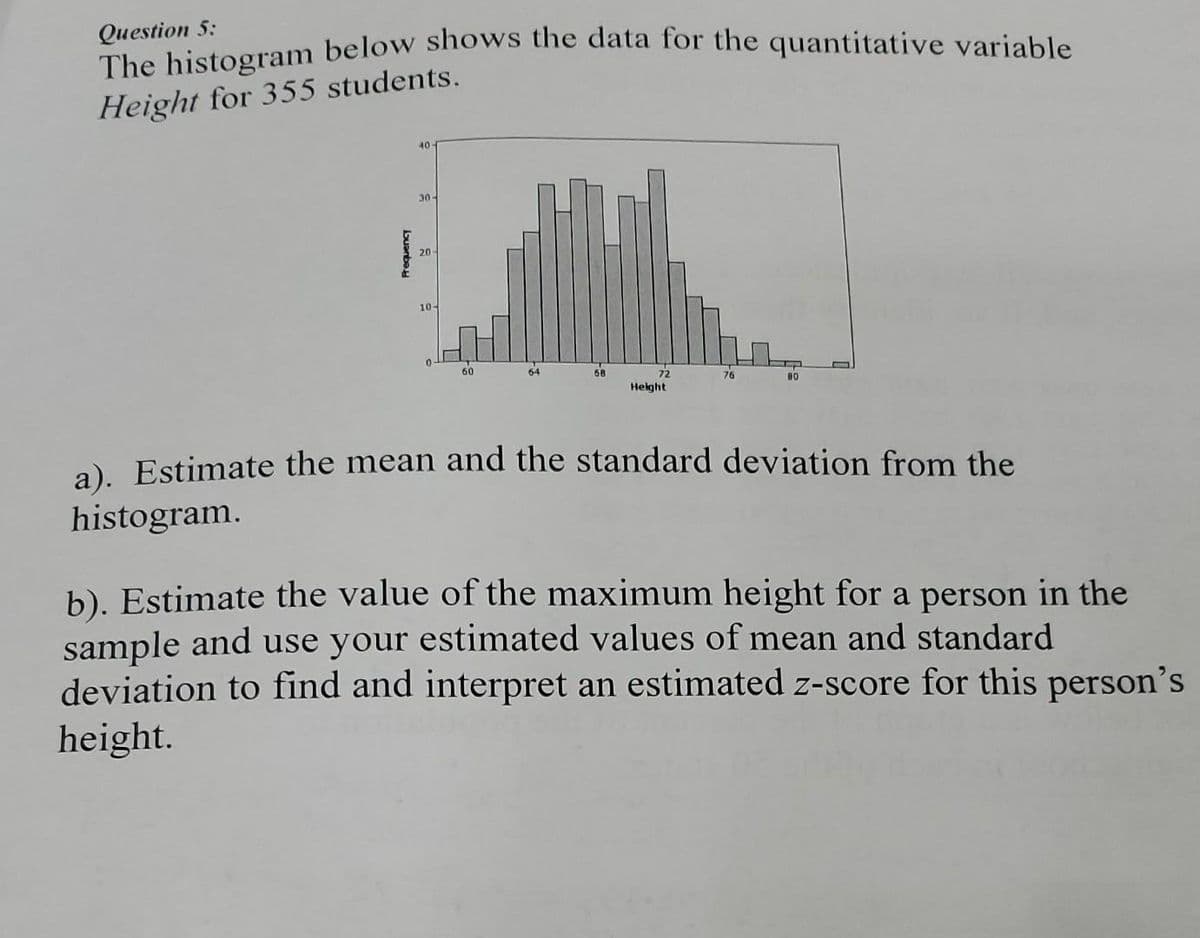
Transcribed Image Text:Question 5:
The histogram below shows the data for the quantitative variable
Height for 355 students.
Frequency
40
30-
20
10-
60
64
68
72
Height
76
80
a). Estimate the mean and the standard deviation from the
histogram.
b). Estimate the value of the maximum height for a person in the
sample and use your estimated values of mean and standard
deviation to find and interpret an estimated z-score for this person's
height.
Expert Solution
This question has been solved!
Explore an expertly crafted, step-by-step solution for a thorough understanding of key concepts.

Step by step
Solved in 2 steps

Recommended textbooks for you
Glencoe Algebra 1, Student Edition, 9780079039897…
Algebra
ISBN:
9780079039897
Author:
Carter
Publisher:
McGraw Hill
Glencoe Algebra 1, Student Edition, 9780079039897…
Algebra
ISBN:
9780079039897
Author:
Carter
Publisher:
McGraw Hill