The histogram shows the distribution of hurricanes that have hit a country from 1851 through 2015, where 1 is the weakest level and 5 is the strongest level. Hurricanes 0.5 0.418 2 0.4 5 0.3 8 0.2 a 0.14 0.01 (a) Find the mean, variance, and standard deviation of the probability distribution. (b) Interpret the results. 0.253 0,224 0.095 Category (a) The mean is. (Type an integer or a decimal. Do not round.)
The histogram shows the distribution of hurricanes that have hit a country from 1851 through 2015, where 1 is the weakest level and 5 is the strongest level. Hurricanes 0.5 0.418 2 0.4 5 0.3 8 0.2 a 0.14 0.01 (a) Find the mean, variance, and standard deviation of the probability distribution. (b) Interpret the results. 0.253 0,224 0.095 Category (a) The mean is. (Type an integer or a decimal. Do not round.)

Glencoe Algebra 1, Student Edition, 9780079039897, 0079039898, 2018
18th Edition
ISBN:9780079039897
Author:Carter
Publisher:Carter
Chapter10: Statistics
Section10.4: Distributions Of Data
Problem 19PFA

Related questions
Question
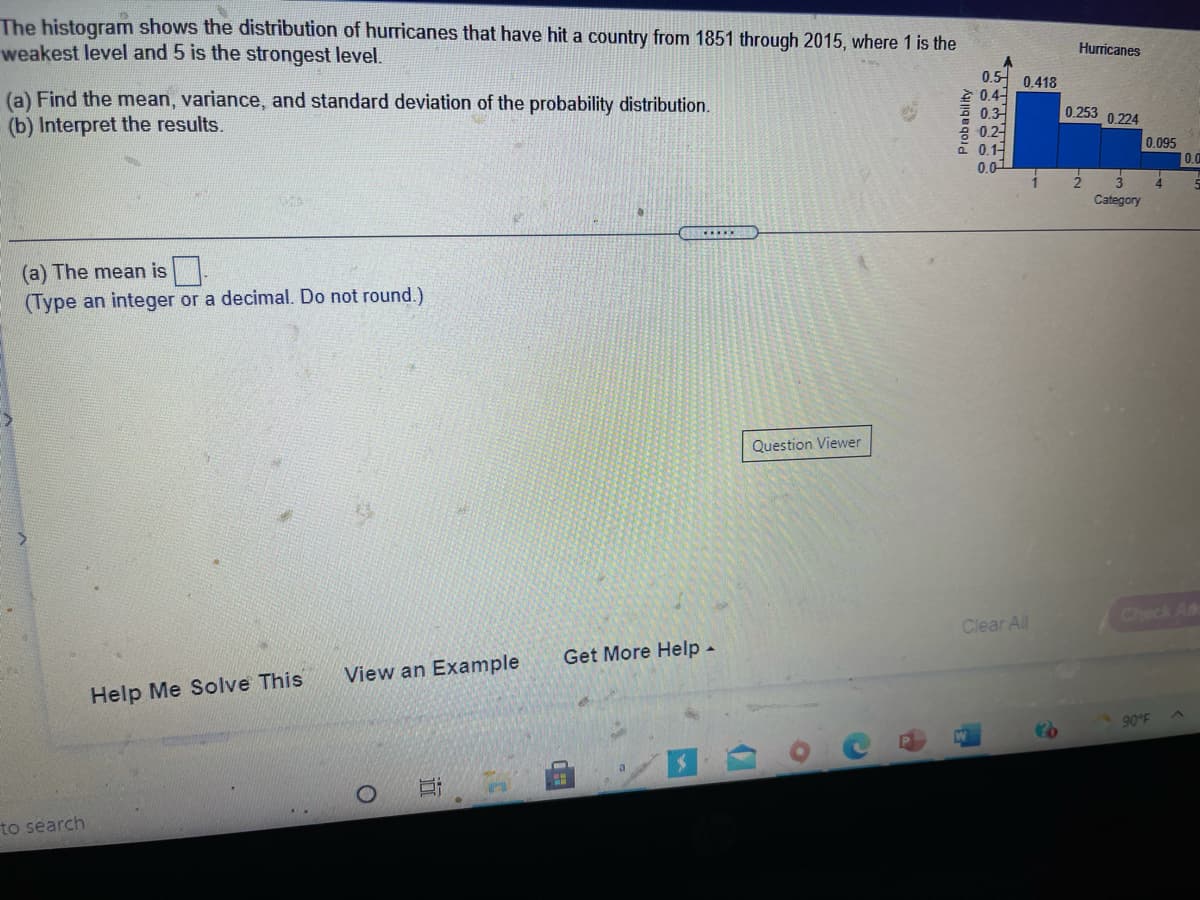
Transcribed Image Text:The histogram shows the distribution of huricanes that have hit a country from 1851 through 2015, where 1 is the
weakest level and 5 is the strongest level.
Hurricanes
0.5 0.418
2 0.4-
0.3
0.2
a 0.1
0.01
(a) Find the mean, variance, and standard deviation of the probability distribution.
(b) Interpret the results.
0,253
0,224
0.095
0.0
Category
(a) The mean is .
(Type an integer or a decimal. Do not round.)
Question Viewer
Check A
Clear All
Get More Help -
View an Example
Help Me Solve This
90°F
to search
Expert Solution
This question has been solved!
Explore an expertly crafted, step-by-step solution for a thorough understanding of key concepts.

This is a popular solution!

Trending now
This is a popular solution!

Step by step
Solved in 3 steps with 4 images

Recommended textbooks for you
Glencoe Algebra 1, Student Edition, 9780079039897…
Algebra
ISBN:
9780079039897
Author:
Carter
Publisher:
McGraw Hill
Glencoe Algebra 1, Student Edition, 9780079039897…
Algebra
ISBN:
9780079039897
Author:
Carter
Publisher:
McGraw Hill