The local government of country X is committed to curb the consumption of tobacco among youngsters owing to its severe health effects. Previous attempts to regulate tobacco consumption have failed to produce any fruitful results. The only possible way out is to tax the consumption of tobacco. Optimal taxation would require a proper knowledge of how price sensitive the consumers are to tobacco consumption. Data is collected by selecting a small sample of individuals at random. It is known that the price elasticity of tobacco consumption follows a normal distribution. Similar studies carried out earlier report that the price elasticity of tobacco consumption has a mean 0.30. The current survey aims to verify whether the value of the mean population price elasticity is actually 0.30 or not. The given table summarises the findings from the survey: Number of individuals surveyed (n) 20 The standard deviation of the sample (Sy 0.34 (SY) The sample mean of price elasticity (Y) 0.47 Given that the sample size is relatively small, is it reliable to assume a normal approximation to the t-statistic for hypothesis testing? A. No, since the t-statistic follows an F distribution in small samples. B. Yes, a normal approximation to the t-statistic can be used for hypothesis testing, but only with n-2 degrees of freedom. C. Yes, since a normal approximation to the t-statistic is independent of the sample size. D. Yes, a normal approximation to the t-statistic is reliable if the population distribution is itself normal and the sample size is greater than 15. Let py denote the average price elasticity of tobacco consumption among youngsters in the entire country. Based on the above information, the t-statistic for the test Нo: μy = 0.30 vs. H₁: μу 0.30 is: (Round your answer to two decimal places). Given the value of the t-statistic, at the 5% level of significance, we the null hypothesis. The 95% confidence interval for the mean price elasticity of tobacco consumption among youngsters in the entire country is: (☐, ■). (Round your answer to two decimal places).
The local government of country X is committed to curb the consumption of tobacco among youngsters owing to its severe health effects. Previous attempts to regulate tobacco consumption have failed to produce any fruitful results. The only possible way out is to tax the consumption of tobacco. Optimal taxation would require a proper knowledge of how price sensitive the consumers are to tobacco consumption. Data is collected by selecting a small sample of individuals at random. It is known that the price elasticity of tobacco consumption follows a normal distribution. Similar studies carried out earlier report that the price elasticity of tobacco consumption has a mean 0.30. The current survey aims to verify whether the value of the mean population price elasticity is actually 0.30 or not. The given table summarises the findings from the survey: Number of individuals surveyed (n) 20 The standard deviation of the sample (Sy 0.34 (SY) The sample mean of price elasticity (Y) 0.47 Given that the sample size is relatively small, is it reliable to assume a normal approximation to the t-statistic for hypothesis testing? A. No, since the t-statistic follows an F distribution in small samples. B. Yes, a normal approximation to the t-statistic can be used for hypothesis testing, but only with n-2 degrees of freedom. C. Yes, since a normal approximation to the t-statistic is independent of the sample size. D. Yes, a normal approximation to the t-statistic is reliable if the population distribution is itself normal and the sample size is greater than 15. Let py denote the average price elasticity of tobacco consumption among youngsters in the entire country. Based on the above information, the t-statistic for the test Нo: μy = 0.30 vs. H₁: μу 0.30 is: (Round your answer to two decimal places). Given the value of the t-statistic, at the 5% level of significance, we the null hypothesis. The 95% confidence interval for the mean price elasticity of tobacco consumption among youngsters in the entire country is: (☐, ■). (Round your answer to two decimal places).

Linear Algebra: A Modern Introduction
4th Edition
ISBN:9781285463247
Author:David Poole
Publisher:David Poole
Chapter7: Distance And Approximation
Section7.3: Least Squares Approximation
Problem 31EQ

Related questions
Question
please answer correctly.
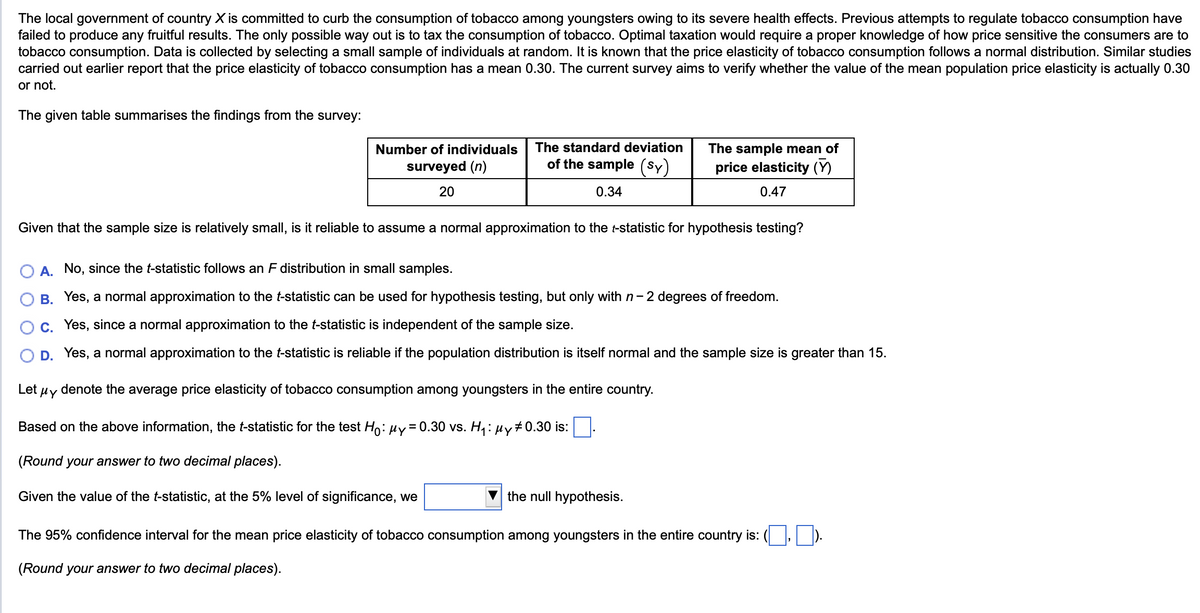
Transcribed Image Text:The local government of country X is committed to curb the consumption of tobacco among youngsters owing to its severe health effects. Previous attempts to regulate tobacco consumption have
failed to produce any fruitful results. The only possible way out is to tax the consumption of tobacco. Optimal taxation would require a proper knowledge of how price sensitive the consumers are to
tobacco consumption. Data is collected by selecting a small sample of individuals at random. It is known that the price elasticity of tobacco consumption follows a normal distribution. Similar studies
carried out earlier report that the price elasticity of tobacco consumption has a mean 0.30. The current survey aims to verify whether the value of the mean population price elasticity is actually 0.30
or not.
The given table summarises the findings from the survey:
Number of individuals
surveyed (n)
20
The standard deviation
of the sample (Sy
0.34
(SY)
The sample mean of
price elasticity (Y)
0.47
Given that the sample size is relatively small, is it reliable to assume a normal approximation to the t-statistic for hypothesis testing?
A. No, since the t-statistic follows an F distribution in small samples.
B. Yes, a normal approximation to the t-statistic can be used for hypothesis testing, but only with n-2 degrees of freedom.
C. Yes, since a normal approximation to the t-statistic is independent of the sample size.
D. Yes, a normal approximation to the t-statistic is reliable if the population distribution is itself normal and the sample size is greater than 15.
Let py
denote the average price elasticity of tobacco consumption among youngsters in the entire country.
Based on the above information, the t-statistic for the test Нo: μy = 0.30 vs. H₁: μу 0.30 is:
(Round your answer to two decimal places).
Given the value of the t-statistic, at the 5% level of significance, we
the null hypothesis.
The 95% confidence interval for the mean price elasticity of tobacco consumption among youngsters in the entire country is: (☐, ■).
(Round your answer to two decimal places).
Expert Solution
This question has been solved!
Explore an expertly crafted, step-by-step solution for a thorough understanding of key concepts.

Step by step
Solved in 2 steps

Recommended textbooks for you
Linear Algebra: A Modern Introduction
Algebra
ISBN:
9781285463247
Author:
David Poole
Publisher:
Cengage Learning
Linear Algebra: A Modern Introduction
Algebra
ISBN:
9781285463247
Author:
David Poole
Publisher:
Cengage Learning