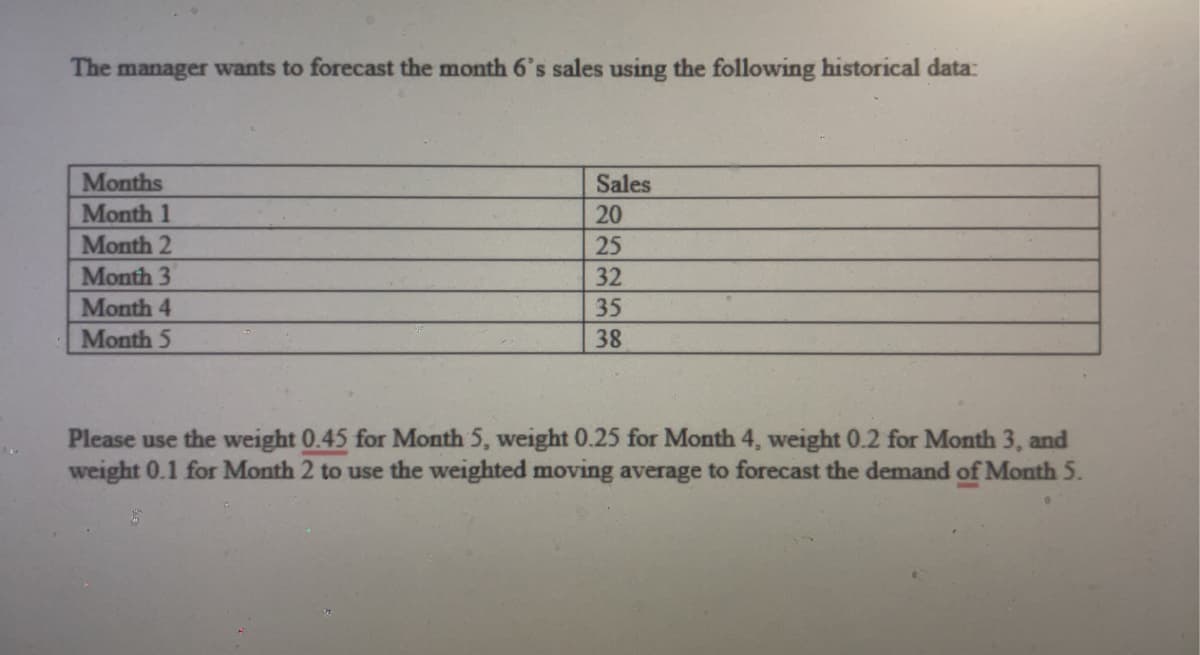
The manager wants to forecast the month 6's sales using the following historical data: Months Month 1 Month 2 Month 3 Month 4 Month 5 Sales 20 25 32 35 38 Please use the weight 0.45 for Month 5, weight 0.25 for Month 4, weight 0.2 for Month 3, and weight 0.1 for Month 2 to use the weighted moving average to forecast the demand of Month 5.


Q: (a) Formulate a BIP model for this problem. (b) Display this model on an Excel spreadsheet.
A: Linear programming is a mathematical technique that is also used in operations management…
Q: According to MM Model, total value of firm is Decreases with the decreases in WACC Constant None of…
A: According to this approach the total cost of capital of a particular firm is independent of its…
Q: CASE 1. Mossaic Tiles, Ltd. Gilbert Moss and Angela Pasaic spent several summers during their…
A: Objective Functions and Constraints: Based on the given details, the objective…
Q: CASE 1. Mossaic Tiles, Ltd. Gilbert Moss and Angela Pasaic spent several summers during their…
A: Given data is Tile type Molding hrs Baking hrs Glazing hours Clay derivative in pounds Larger…
Q: Find the optimal solution for the following problem. (Round your answers to 3 decimal places.)…
A: Max Z = 18x + 23y +10zSubject to14x + 16y +23z ≤569x + 0y +7z≤112x, y, z ≥0
Q: Use simple exponential smoothing with a 0.6 to forecast chargers sales for February through May.…
A:
Q: 1. Formulate a linear programming model for Angela and Zooey that will help them estimate the number…
A: Linear programming is a mathematical technique that is also used in operations management…
Q: Required: a. Solve the model formulated for Southern Sporting Goods Company using the computer. b.…
A: Linear programming is a mathematical technique that is also used in operations management…
Q: XYZ, Inc., is a small firm that produces a variety of chemical products. In a particular production…
A: “Since you have posted a question with multiple sub-parts, we will solve the first three sub-parts…
Q: 5 labor nours na 5 boxes. And the last one needs 2 of raw material and 10 of labor hours and 3…
A: Linear programming is a mathematical technique used in the fields of optimization, operations…
Q: How does this supply chain differ from that in a manufacturing firm?
A: A supply chain is indeed the web of people, businesses, materials, operations, and technology…
Q: Tesla's Vertical Integration Is Something Automakers Are Eager To CopyAutomotive manufacturing has…
A: Pandemic brought a tough time for almost all the industries and economies. Some got largely…
Q: 1. A town receives electricity generated from three forms of energy: solar, wind, tide. Consumer…
A:
Q: The master production schedule (MPS) specifies: Select one: None of the mentioned When the finished…
A: Master production schedule often called MPS can be stated as the term that is used to describe the…
Q: 1. Southern Sporting Goods Company makes basketballs and footballs. Each product is produced from…
A: Objective Functions and Constraints: Based on the given details, the objective…
Q: The Academic Computer Center has five trainers available in its computer labs to provide training…
A: Operational efficiency is described as the organizational ability to focus on the reduction of…
Q: Mid-West Publishing Company publishes college textbooks. The company operates an 800 telephone…
A: The question is related to the Probability. The details are given regarding the same.
Q: Why should Operations Management be taught in course curriculum of BBA? What is OM all about? Why is…
A: It is a course which is used to design to provide knowledge to the business professionals about the…
Q: hod with stakeholders?
A: For a product, a prototype is a pre-production version. It’s utilized as an early, affordable sample…
Q: List the interrelated components of the performance management process and. explain how the poor…
A: Performance management:- The performance management process is designed to ensure that desired…
Q: Describe how project management software may be used to help with project planning. Describe and…
A: Project management is the process of connecting all the activities involved in a project to achieve…
Q: The number of salespeople assigned to work during a shift is apportioned based on the average number…
A:
Q: CA Corporate has an available funds of $200,000 is considering for new investment opportunities. The…
A: Investment portfolio of stocks is given as follows:
Q: CASE 3. Burger Doodle The manager of a Burger Doodle franchise wants to determine how many sausage…
A: Given data is Biscuit Labor Sausage Ham Flour Sausage 0.010 hr 0.10lb - 0.04lb Ham 0.024 hr -…
Q: nswer. Level output/workforce strategy: Monthly planning for all the products in same family…
A: The term "aggregate planning" is used to describe the process of developing, updating, and…
Q: O A-B-D-F-G-H O A-C-E-H O A-B-D-E-H O A-C-E-F-G-H c. How many weeks will it take to complete the…
A: The critical path method is a project management tool that is used to help plan and schedule the…
Q: Under ideal conditions, a picture frame manufacturing facility can produce 480 frames per day. Under…
A: Given data Under the ideal scenario, a firm manufactures 480 frames in a day Under a normal…
Q: What are the differences between manufacturing process type & service process type?
A: To run a successful business, you must have processes to ensure efficiency and productivity. At…
Q: Consider the transportation table below. (a) Use the Northwest-Corner Method, the Least-Cost Method…
A: Find the given details below: Given details: Factory Warehouse A B C D Supply 1 4 7 7 1…
Q: Consider the following LP problem developed at Zafar Malik's Carbondale, Illinois, optical scanning…
A: Given data is Objective function: Max Z=X1+X2 Subject to constraints: 1.) 2X1+1X2≤602.)…
Q: c Golf Cart c golf cart Time on Hand 1 0 10
A: Given: Parts List for Electric Golf Cart Lead Time Quantity on Hand Electric golf cart 1 0…
Q: A linear programming computer package is needed. of a of customers make reservations via phone.…
A: Given data is Day Minimum employees needed Monday 75 Tuesday 55 Wednesday 50 Thursday 70…
Q: a.) For what values of volume, V, of production, if any, is site C a recommended site? b.) What…
A: Crossover analysis is the analysis through which a point is identified for the better cost or profit…
Q: A four-step process has processing times of 2, 4, 7, and 5 minutes for the four steps (listed from…
A: Given data: A four-step process has processing times of = 2, 4, 7, & 5 minutes After 3rd item…
Q: Question 9 Shortening (crashing) the schedule goal is to reduce the project duration with a increase…
A: Note- Hi! Thank you for the question As per the honour code, We’ll answer the first question since…
Q: HELP
A:
Q: he dreamt of becoming a “businessman” and would go into stores in the city where he lived and…
A: Based on the above information four strategies are 1) Preparing and development 2) Valuing strategy…
Q: It is of the utmost importance to educate customers on the best ways to defend themselves against…
A: Session hijacking is as the term suggests. A user in a session can be hijacked by an attacker and…
Q: Before project closure is possible, which one of the following is responsible for demonstrating that…
A: The success and failure of the projects lean on the team to fulfill the clients’ documented approval…
Q: When a company creates a logistics strategy it is defining the service levels at which its logistics…
A: Customer service can be defined as a measure of the effectiveness of a logistical system in the…
Q: you are the manager of a group of 10 staff within the firm you work for. Your staff have shown to be…
A: As a manager, you have some responsibility for your employees' motivation and well-being. All…
Q: Aldiscuss Three important Hazard Identification processes are. AND Why non a) Audits conducted by…
A: Occupational Safety and Health Administration often called OSHA can be stated as the main federal…
Q: 1. Southern Sporting Goods Company makes basketballs and footballs. Each product is produced from…
A: Objective Functions and Constraints: Based on the given details, the objective…
Q: Explain how a business case relates to a technological project and why it's important.
A: A business case provides a reason to begin a business project. It estimates the risks, price, and…
Q: evaluate the ways in which time and quality effect the cost of a project
A: One of the first components of developing an overall project management plan is to decipher all the…
Q: 2-1. Use the graphical method to find the solution to the linear programming problems: - Min. Z =…
A: Linear programming is a mathematical technique that is also used in operations management…
Q: INSTRUCTIONS: 1. Read and understand the cases/problems properly. 2. Create an excel solution for…
A: Let, B = Units of basketball to be produced F = Units of Football to be produced Objective…
Q: b. Key positions can be staffed with experts. c. It is difficult to integrate activities across…
A: Functional organisational design:- A functional organization is designed like the typical…
Q: Company QAW has two bottling plants in California and Alaska that can produce 10000 and 6000 bottles…
A: Find the Given details below: Given details: Plants Bottle sizes 500 mL 1 L 1.5 L…
Q: XYZ Print Inc. uses plain paper for copying needs. Weekly demand for that paper follows a normal…
A: Given data: Weekly average demand=100 and the standard deviation =50, each week, a replenishment…


Trending now
This is a popular solution!

Step by step
Solved in 2 steps with 1 images

- Suppose that a regional express delivery service company wants to estimate the cost of shipping a package (Y) as a function of cargo type, where cargo type includes the following possibilities: fragile, semifragile, and durable. Costs for 15 randomly chosen packages of approximately the same weight and same distance shipped, but of different cargo types, are provided in the file P13_16.xlsx. a. Estimate a regression equation using the given sample data, and interpret the estimated regression coefficients. b. According to the estimated regression equation, which cargo type is the most costly to ship? Which cargo type is the least costly to ship? c. How well does the estimated equation fit the given sample data? How might the fit be improved? d. Given the estimated regression equation, predict the cost of shipping a package with semifragile cargo.The Baker Company wants to develop a budget to predict how overhead costs vary with activity levels. Management is trying to decide whether direct labor hours (DLH) or units produced is the better measure of activity for the firm. Monthly data for the preceding 24 months appear in the file P13_40.xlsx. Use regression analysis to determine which measure, DLH or Units (or both), should be used for the budget. How would the regression equation be used to obtain the budget for the firms overhead costs?An automobile manufacturer is considering whether to introduce a new model called the Racer. The profitability of the Racer depends on the following factors: The fixed cost of developing the Racer is triangularly distributed with parameters 3, 4, and 5, all in billions. Year 1 sales are normally distributed with mean 200,000 and standard deviation 50,000. Year 2 sales are normally distributed with mean equal to actual year 1 sales and standard deviation 50,000. Year 3 sales are normally distributed with mean equal to actual year 2 sales and standard deviation 50,000. The selling price in year 1 is 25,000. The year 2 selling price will be 1.05[year 1 price + 50 (% diff1)] where % diff1 is the number of percentage points by which actual year 1 sales differ from expected year 1 sales. The 1.05 factor accounts for inflation. For example, if the year 1 sales figure is 180,000, which is 10 percentage points below the expected year 1 sales, then the year 2 price will be 1.05[25,000 + 50( 10)] = 25,725. Similarly, the year 3 price will be 1.05[year 2 price + 50(% diff2)] where % diff2 is the percentage by which actual year 2 sales differ from expected year 2 sales. The variable cost in year 1 is triangularly distributed with parameters 10,000, 12,000, and 15,000, and it is assumed to increase by 5% each year. Your goal is to estimate the NPV of the new car during its first three years. Assume that the company is able to produce exactly as many cars as it can sell. Also, assume that cash flows are discounted at 10%. Simulate 1000 trials to estimate the mean and standard deviation of the NPV for the first three years of sales. Also, determine an interval such that you are 95% certain that the NPV of the Racer during its first three years of operation will be within this interval.
- Stock market analysts are continually looking for reliable predictors of stock prices. Consider the problem of modeling the price per share of electric utility stocks (Y). Two variables thought to influence this stock price are return on average equity (X1) and annual dividend rate (X2). The stock price, returns on equity, and dividend rates on a randomly selected day for 16 electric utility stocks are provided in the file P13_15.xlsx. Estimate a multiple regression equation using the given data. Interpret each of the estimated regression coefficients. Also, interpret the standard error of estimate and the R-square value for these data.Play Things is developing a new Lady Gaga doll. The company has made the following assumptions: The doll will sell for a random number of years from 1 to 10. Each of these 10 possibilities is equally likely. At the beginning of year 1, the potential market for the doll is two million. The potential market grows by an average of 4% per year. The company is 95% sure that the growth in the potential market during any year will be between 2.5% and 5.5%. It uses a normal distribution to model this. The company believes its share of the potential market during year 1 will be at worst 30%, most likely 50%, and at best 60%. It uses a triangular distribution to model this. The variable cost of producing a doll during year 1 has a triangular distribution with parameters 15, 17, and 20. The current selling price is 45. Each year, the variable cost of producing the doll will increase by an amount that is triangularly distributed with parameters 2.5%, 3%, and 3.5%. You can assume that once this change is generated, it will be the same for each year. You can also assume that the company will change its selling price by the same percentage each year. The fixed cost of developing the doll (which is incurred right away, at time 0) has a triangular distribution with parameters 5 million, 7.5 million, and 12 million. Right now there is one competitor in the market. During each year that begins with four or fewer competitors, there is a 25% chance that a new competitor will enter the market. Year t sales (for t 1) are determined as follows. Suppose that at the end of year t 1, n competitors are present (including Play Things). Then during year t, a fraction 0.9 0.1n of the company's loyal customers (last year's purchasers) will buy a doll from Play Things this year, and a fraction 0.2 0.04n of customers currently in the market ho did not purchase a doll last year will purchase a doll from Play Things this year. Adding these two provides the mean sales for this year. Then the actual sales this year is normally distributed with this mean and standard deviation equal to 7.5% of the mean. a. Use @RISK to estimate the expected NPV of this project. b. Use the percentiles in @ RISKs output to find an interval such that you are 95% certain that the companys actual NPV will be within this interval.The management of a technology company is trying to determine the variable that best explains the variation of employee salaries using a sample of 52 full-time employees; see the file P13_08.xlsx. Estimate simple linear regression equations to identify which of the following has the strongest linear relationship with annual salary: the employees gender, age, number of years of relevant work experience prior to employment at the company, number of years of employment at the company, or number of years of post secondary education. Provide support for your conclusion.
- The file P13_28.xlsx contains monthly retail sales of U.S. liquor stores. a. Is seasonality present in these data? If so, characterize the seasonality pattern. b. Use Winters method to forecast this series with smoothing constants = = 0.1 and = 0.3. Does the forecast series seem to track the seasonal pattern well? What are your forecasts for the next 12 months?The file P13_29.xlsx contains monthly time series data for total U.S. retail sales of building materials (which includes retail sales of building materials, hardware and garden supply stores, and mobile home dealers). a. Is seasonality present in these data? If so, characterize the seasonality pattern. b. Use Winters method to forecast this series with smoothing constants = = 0.1 and = 0.3. Does the forecast series seem to track the seasonal pattern well? What are your forecasts for the next 12 months?When you use a RISKSIMTABLE function for a decision variable, such as the order quantity in the Walton model, explain how this provides a fair comparison across the different values tested.
- A company manufacturers a product in the United States and sells it in England. The unit cost of manufacturing is 50. The current exchange rate (dollars per pound) is 1.221. The demand function, which indicates how many units the company can sell in England as a function of price (in pounds) is of the power type, with constant 27556759 and exponent 2.4. a. Develop a model for the companys profit (in dollars) as a function of the price it charges (in pounds). Then use a data table to find the profit-maximizing price to the nearest pound. b. If the exchange rate varies from its current value, does the profit-maximizing price increase or decrease? Does the maximum profit increase or decrease?A small computer chip manufacturer wants to forecast monthly ozperating costs as a function of the number of units produced during a month. The company has collected the 16 months of data in the file P13_34.xlsx. a. Determine an equation that can be used to predict monthly production costs from units produced. Are there any outliers? b. How could the regression line obtained in part a be used to determine whether the company was efficient or inefficient during any particular month?The eTech Company is a fairly recent entry in the electronic device area. The company competes with Apple. Samsung, and other well-known companies in the manufacturing and sales of personal handheld devices. Although eTech recognizes that it is a niche player and will likely remain so in the foreseeable future, it is trying to increase its current small market share in this huge competitive market. Jim Simons, VP of Production, and Catherine Dolans, VP of Marketing, have been discussing the possible addition of a new product to the companys current (rather limited) product line. The tentative name for this new product is ePlayerX. Jim and Catherine agree that the ePlayerX, which will feature a sleeker design and more memory, is necessary to compete successfully with the big boys, but they are also worried that the ePlayerX could cannibalize sales of their existing productsand that it could even detract from their bottom line. They must eventually decide how much to spend to develop and manufacture the ePlayerX and how aggressively to market it. Depending on these decisions, they must forecast demand for the ePlayerX, as well as sales for their existing products. They also realize that Apple. Samsung, and the other big players are not standing still. These competitors could introduce their own new products, which could have very negative effects on demand for the ePlayerX. The expected timeline for the ePlayerX is that development will take no more than a year to complete and that the product will be introduced in the market a year from now. Jim and Catherine are aware that there are lots of decisions to make and lots of uncertainties involved, but they need to start somewhere. To this end. Jim and Catherine have decided to base their decisions on a planning horizon of four years, including the development year. They realize that the personal handheld device market is very fluid, with updates to existing products occurring almost continuously. However, they believe they can include such considerations into their cost, revenue, and demand estimates, and that a four-year planning horizon makes sense. In addition, they have identified the following problem parameters. (In this first pass, all distinctions are binary: low-end or high-end, small-effect or large-effect, and so on.) In the absence of cannibalization, the sales of existing eTech products are expected to produce year I net revenues of 10 million, and the forecast of the annual increase in net revenues is 2%. The ePIayerX will be developed as either a low-end or a high-end product, with corresponding fixed development costs (1.5 million or 2.5 million), variable manufacturing costs ( 100 or 200). and selling prices (150 or 300). The fixed development cost is incurred now, at the beginning of year I, and the variable cost and selling price are assumed to remain constant throughout the planning horizon. The new product will be marketed either mildly aggressively or very aggressively, with corresponding costs. The costs of a mildly aggressive marketing campaign are 1.5 million in year 1 and 0.5 million annually in years 2 to 4. For a very aggressive campaign, these costs increase to 3.5 million and 1.5 million, respectively. (These marketing costs are not part of the variable cost mentioned in the previous bullet; they are separate.) Depending on whether the ePlayerX is a low-end or high-end produce the level of the ePlayerXs cannibalization rate of existing eTech products will be either low (10%) or high (20%). Each cannibalization rate affects only sales of existing products in years 2 to 4, not year I sales. For example, if the cannibalization rate is 10%, then sales of existing products in each of years 2 to 4 will be 10% below their projected values without cannibalization. A base case forecast of demand for the ePlayerX is that in its first year on the market, year 2, demand will be for 100,000 units, and then demand will increase by 5% annually in years 3 and 4. This base forecast is based on a low-end version of the ePlayerX and mildly aggressive marketing. It will be adjusted for a high-end will product, aggressive marketing, and competitor behavior. The adjustments with no competing product appear in Table 2.3. The adjustments with a competing product appear in Table 2.4. Each adjustment is to demand for the ePlayerX in each of years 2 to 4. For example, if the adjustment is 10%, then demand in each of years 2 to 4 will be 10% lower than it would have been in the base case. Demand and units sold are the samethat is, eTech will produce exactly what its customers demand so that no inventory or backorders will occur. Table 2.3 Demand Adjustments When No Competing Product Is Introduced Table 2.4 Demand Adjustments When a Competing Product Is Introduced Because Jim and Catherine are approaching the day when they will be sharing their plans with other company executives, they have asked you to prepare an Excel spreadsheet model that will answer the many what-if questions they expect to be asked. Specifically, they have asked you to do the following: You should enter all of the given data in an inputs section with clear labeling and appropriate number formatting. If you believe that any explanations are required, you can enter them in text boxes or cell comments. In this section and in the rest of the model, all monetary values (other than the variable cost and the selling price) should be expressed in millions of dollars, and all demands for the ePlayerX should be expressed in thousands of units. You should have a scenario section that contains a 0/1 variable for each of the binary options discussed here. For example, one of these should be 0 if the low-end product is chosen and it should be 1 if the high-end product is chosen. You should have a parameters section that contains the values of the various parameters listed in the case, depending on the values of the 0/1 variables in the previous bullet For example, the fixed development cost will be 1.5 million or 2.5 million depending on whether the 0/1 variable in the previous bullet is 0 or 1, and this can be calculated with a simple IF formula. You can decide how to implement the IF logic for the various parameters. You should have a cash flows section that calculates the annual cash flows for the four-year period. These cash flows include the net revenues from existing products, the marketing costs for ePlayerX, and the net revenues for sales of ePlayerX (To calculate these latter values, it will help to have a row for annual units sold of ePlayerX.) The cash flows should also include depreciation on the fixed development cost, calculated on a straight-line four-year basis (that is. 25% of the cost in each of the four years). Then, these annual revenues/costs should be summed for each year to get net cash flow before taxes, taxes should be calculated using a 32% tax rate, and taxes should be subtracted and depreciation should be added back in to get net cash flows after taxes. (The point is that depreciation is first subtracted, because it is not taxed, but then it is added back in after taxes have been calculated.) You should calculate the company's NPV for the four-year horizon using a discount rate of 10%. You can assume that the fixed development cost is incurred now. so that it is not discounted, and that all other costs and revenues are incurred at the ends of the respective years. You should accompany all of this with a line chart with three series: annual net revenues from existing products; annual marketing costs for ePlayerX; and annual net revenues from sales of ePlayerX. Once all of this is completed. Jim and Catherine will have a powerful tool for presentation purposes. By adjusting the 0/1 scenario variables, their audience will be able to see immediately, both numerically and graphically, the financial consequences of various scenarios.