The normal probability density function g(x) = ov2n Where u = mean, o = standard deviation, n = 3.14159, e 2.71828 Let's study a special case where u = 0 and o = 1, which indicates a standard normal probability density function. For simplicity, we scale the function so as to remove the factor 1/(ov2n). Now, we have a new function f(x) f(x) = e (a) Find f'(x) and show the intervals of increase or decrease for f. (b) Find the extreme value of f. (c) Find the intervals of concavity and the inflection points. (d) Sketch the graph of f and point out the extremum value and inflection points.
The normal probability density function g(x) = ov2n Where u = mean, o = standard deviation, n = 3.14159, e 2.71828 Let's study a special case where u = 0 and o = 1, which indicates a standard normal probability density function. For simplicity, we scale the function so as to remove the factor 1/(ov2n). Now, we have a new function f(x) f(x) = e (a) Find f'(x) and show the intervals of increase or decrease for f. (b) Find the extreme value of f. (c) Find the intervals of concavity and the inflection points. (d) Sketch the graph of f and point out the extremum value and inflection points.

A First Course in Probability (10th Edition)
10th Edition
ISBN:9780134753119
Author:Sheldon Ross
Publisher:Sheldon Ross
Chapter1: Combinatorial Analysis
Section: Chapter Questions
Problem 1.1P: a. How many different 7-place license plates are possible if the first 2 places are for letters and...

Related questions

Question
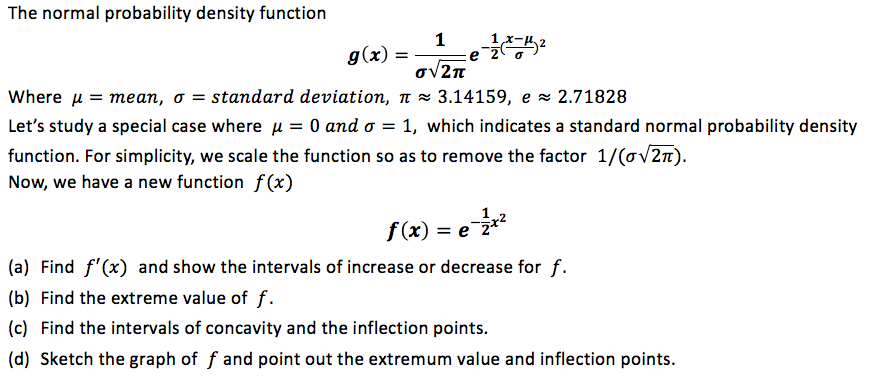
Transcribed Image Text:The normal probability density function
g(x) =
ov2n
Where u = mean, o = standard deviation, n = 3.14159, e
2.71828
Let's study a special case where u = 0 and o = 1, which indicates a standard normal probability density
function. For simplicity, we scale the function so as to remove the factor 1/(ov2n).
Now, we have a new function f(x)
f(x) = e
(a) Find f'(x) and show the intervals of increase or decrease for f.
(b) Find the extreme value of f.
(c) Find the intervals of concavity and the inflection points.
(d) Sketch the graph of f and point out the extremum value and inflection points.
Expert Solution
This question has been solved!
Explore an expertly crafted, step-by-step solution for a thorough understanding of key concepts.

This is a popular solution!

Trending now
This is a popular solution!

Step by step
Solved in 4 steps with 7 images

Knowledge Booster


Learn more about
Need a deep-dive on the concept behind this application? Look no further. Learn more about this topic, probability and related others by exploring similar questions and additional content below.Recommended textbooks for you
A First Course in Probability (10th Edition)
Probability
ISBN:
9780134753119
Author:
Sheldon Ross
Publisher:
PEARSON

A First Course in Probability (10th Edition)
Probability
ISBN:
9780134753119
Author:
Sheldon Ross
Publisher:
PEARSON