The number N of locations of a popular coffeehouse chain is given in the table. (The numbers of locations as of October 1 are given.) Year 2004 2005 2006 2007 2008 8567 10,244 12,441 15,011 16,683 (a) Find the average rate of growth between each pair of years. 2004 to 2006 locations/year 2006 to 2007 locations/year 2005 to 2006 locations/year (b) Estimate the instantaneous rate of growth in 2006 by taking the average of the last two rates of change in part (a). locations/year (c) Estimate the instantaneous rate of growth in 2006 by measuring the slope of the secant line through (2005, 10244) and (2007, 15011). locations/year (d) Estimate the instantaneous rate of growth in 2007 by measuring the slope of the secant line through (2006, 12441) and (2008, 16683). locations/year Compare the growth rates you obtained in part (c) and (d). What can you conclude? O The rate of growth is decreasing. There is not enough information. O The rate of growth is constant. O The rate of growth is increasing.
The number N of locations of a popular coffeehouse chain is given in the table. (The numbers of locations as of October 1 are given.) Year 2004 2005 2006 2007 2008 8567 10,244 12,441 15,011 16,683 (a) Find the average rate of growth between each pair of years. 2004 to 2006 locations/year 2006 to 2007 locations/year 2005 to 2006 locations/year (b) Estimate the instantaneous rate of growth in 2006 by taking the average of the last two rates of change in part (a). locations/year (c) Estimate the instantaneous rate of growth in 2006 by measuring the slope of the secant line through (2005, 10244) and (2007, 15011). locations/year (d) Estimate the instantaneous rate of growth in 2007 by measuring the slope of the secant line through (2006, 12441) and (2008, 16683). locations/year Compare the growth rates you obtained in part (c) and (d). What can you conclude? O The rate of growth is decreasing. There is not enough information. O The rate of growth is constant. O The rate of growth is increasing.

Chapter6: Exponential And Logarithmic Functions
Section6.8: Fitting Exponential Models To Data
Problem 3TI: Table 6 shows the population, in thousands, of harbor seals in the Wadden Sea over the years 1997 to...

Related questions
Question
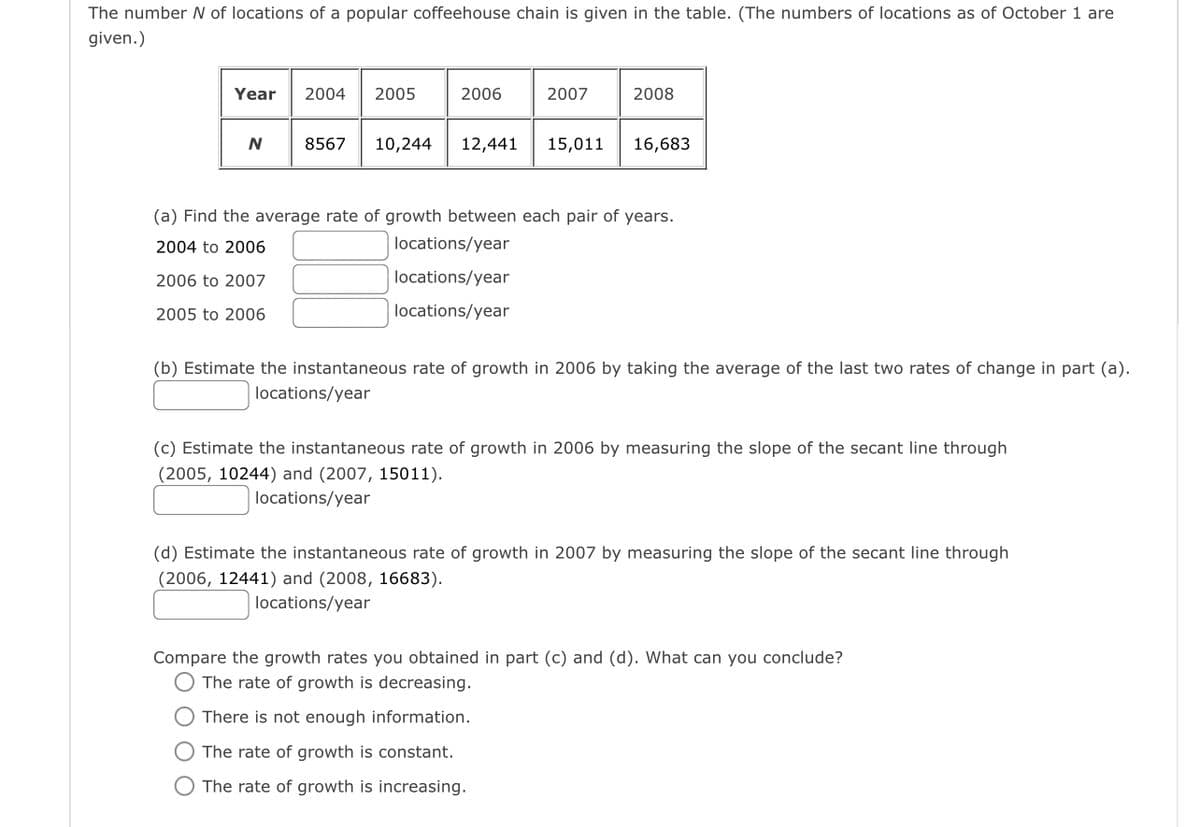
Transcribed Image Text:The number N of locations of a popular coffeehouse chain is given in the table. (The numbers of locations as of October 1 are
given.)
Year
2004
2005
2006
2007
2008
8567
10,244
12,441
15,011
16,683
(a) Find the average rate of growth between each pair of years.
2004 to 2006
locations/year
2006 to 2007
locations/year
2005 to 2006
locations/year
(b) Estimate the instantaneous rate of growth in 2006 by taking the average of the last two rates of change in part (a).
locations/year
(c) Estimate the instantaneous rate of growth in 2006 by measuring the slope of the secant line through
(2005, 10244) and (2007, 15011).
locations/year
(d) Estimate the instantaneous rate of growth in 2007 by measuring the slope of the secant line through
(2006, 12441) and (2008, 16683).
locations/year
Compare the growth rates you obtained in part (c) and (d). What can you conclude?
O The rate of growth is decreasing.
There is not enough information.
The rate of growth is constant.
The rate of growth is increasing.
Expert Solution
This question has been solved!
Explore an expertly crafted, step-by-step solution for a thorough understanding of key concepts.

Step by step
Solved in 3 steps with 3 images

Recommended textbooks for you

Algebra & Trigonometry with Analytic Geometry
Algebra
ISBN:
9781133382119
Author:
Swokowski
Publisher:
Cengage

Linear Algebra: A Modern Introduction
Algebra
ISBN:
9781285463247
Author:
David Poole
Publisher:
Cengage Learning
Algebra & Trigonometry with Analytic Geometry
Algebra
ISBN:
9781133382119
Author:
Swokowski
Publisher:
Cengage
Linear Algebra: A Modern Introduction
Algebra
ISBN:
9781285463247
Author:
David Poole
Publisher:
Cengage Learning

Glencoe Algebra 1, Student Edition, 9780079039897…
Algebra
ISBN:
9780079039897
Author:
Carter
Publisher:
McGraw Hill