The number of people infected by a disease can be represented by D(t) = 2', where D represents the number of people infected on day t What is the average rate of change from day 3 to day 7? O The number of people infected increases by 24 people per day. O The number of people infected increases by 25 people per day. O The number of people infected increases by 30 people per day. O The number of people infected increases by 16 people per day.
The number of people infected by a disease can be represented by D(t) = 2', where D represents the number of people infected on day t What is the average rate of change from day 3 to day 7? O The number of people infected increases by 24 people per day. O The number of people infected increases by 25 people per day. O The number of people infected increases by 30 people per day. O The number of people infected increases by 16 people per day.

Chapter3: Polynomial Functions
Section3.5: Mathematical Modeling And Variation
Problem 7ECP: The kinetic energy E of an object varies jointly with the object’s mass m and the square of the...

Related questions
Question
39
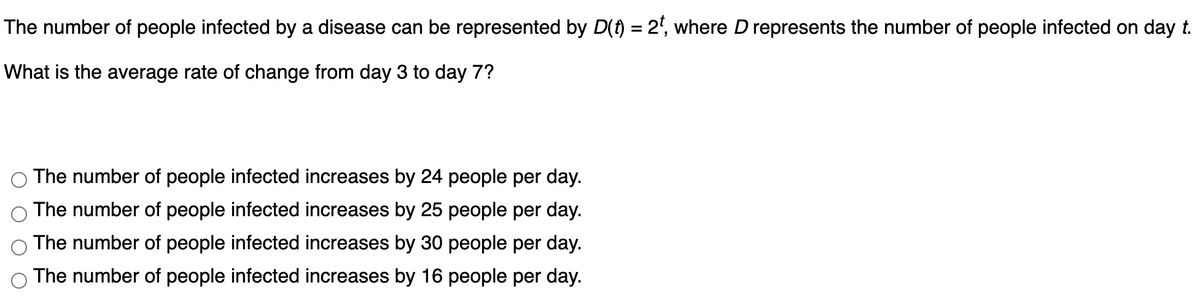
Transcribed Image Text:The number of people infected by a disease can be represented by D(f) = 2', where D represents the number of people infected on day t.
What is the average rate of change from day 3 to day 7?
The number of people infected increases by 24 people per day.
The number of people infected increases by 25 people per day.
The number of people infected increases by 30 people per day.
The number of people infected increases by 16 people per day.
Expert Solution
This question has been solved!
Explore an expertly crafted, step-by-step solution for a thorough understanding of key concepts.

This is a popular solution!

Trending now
This is a popular solution!

Step by step
Solved in 2 steps with 2 images

Recommended textbooks for you

Functions and Change: A Modeling Approach to Coll…
Algebra
ISBN:
9781337111348
Author:
Bruce Crauder, Benny Evans, Alan Noell
Publisher:
Cengage Learning

Trigonometry (MindTap Course List)
Trigonometry
ISBN:
9781337278461
Author:
Ron Larson
Publisher:
Cengage Learning
Functions and Change: A Modeling Approach to Coll…
Algebra
ISBN:
9781337111348
Author:
Bruce Crauder, Benny Evans, Alan Noell
Publisher:
Cengage Learning
Trigonometry (MindTap Course List)
Trigonometry
ISBN:
9781337278461
Author:
Ron Larson
Publisher:
Cengage Learning