The number of pieces of mail received daily at the school office is normally distributed with mean H = 100.33 pieces per day and standard deviation ơ = 25.55 pieces per day. Use the 68-95-99.7 Rule to compute the values in Parts (a) and (b). (a) Between what two values do the middle 95% of daily mail delivery amounts fall? (b) Give the value such that only 2.5% of days have more mail delivery than that day's value. Use Table Z to answer the following questions. (c) On what percentage of days do they get less than 65 pieces of mail? (d) On what percentage of days do they get more than 140 pieces of mail? Draw a diagram showing the number of pieces of mail and shade the appropriate area on the diagram. 62.171 Introductory Statistics Lab Assignment 5 Page 3 of 3 (e) What percentage of days receive an amount of mail daily that is more than 1.75 standard deviations away from the mean? Draw a diagram labeling the Z-scores and shade the appro- priate area on the diagram. (f) What percentage of days receive an amount of mail daily that is within 1.75 standard devia- tions of the mean? Draw a diagram labeling the Z-scores and shade the appropriate area on the diagram.
The number of pieces of mail received daily at the school office is normally distributed with mean H = 100.33 pieces per day and standard deviation ơ = 25.55 pieces per day. Use the 68-95-99.7 Rule to compute the values in Parts (a) and (b). (a) Between what two values do the middle 95% of daily mail delivery amounts fall? (b) Give the value such that only 2.5% of days have more mail delivery than that day's value. Use Table Z to answer the following questions. (c) On what percentage of days do they get less than 65 pieces of mail? (d) On what percentage of days do they get more than 140 pieces of mail? Draw a diagram showing the number of pieces of mail and shade the appropriate area on the diagram. 62.171 Introductory Statistics Lab Assignment 5 Page 3 of 3 (e) What percentage of days receive an amount of mail daily that is more than 1.75 standard deviations away from the mean? Draw a diagram labeling the Z-scores and shade the appro- priate area on the diagram. (f) What percentage of days receive an amount of mail daily that is within 1.75 standard devia- tions of the mean? Draw a diagram labeling the Z-scores and shade the appropriate area on the diagram.

A First Course in Probability (10th Edition)
10th Edition
ISBN:9780134753119
Author:Sheldon Ross
Publisher:Sheldon Ross
Chapter1: Combinatorial Analysis
Section: Chapter Questions
Problem 1.1P: a. How many different 7-place license plates are possible if the first 2 places are for letters and...

Related questions

Question
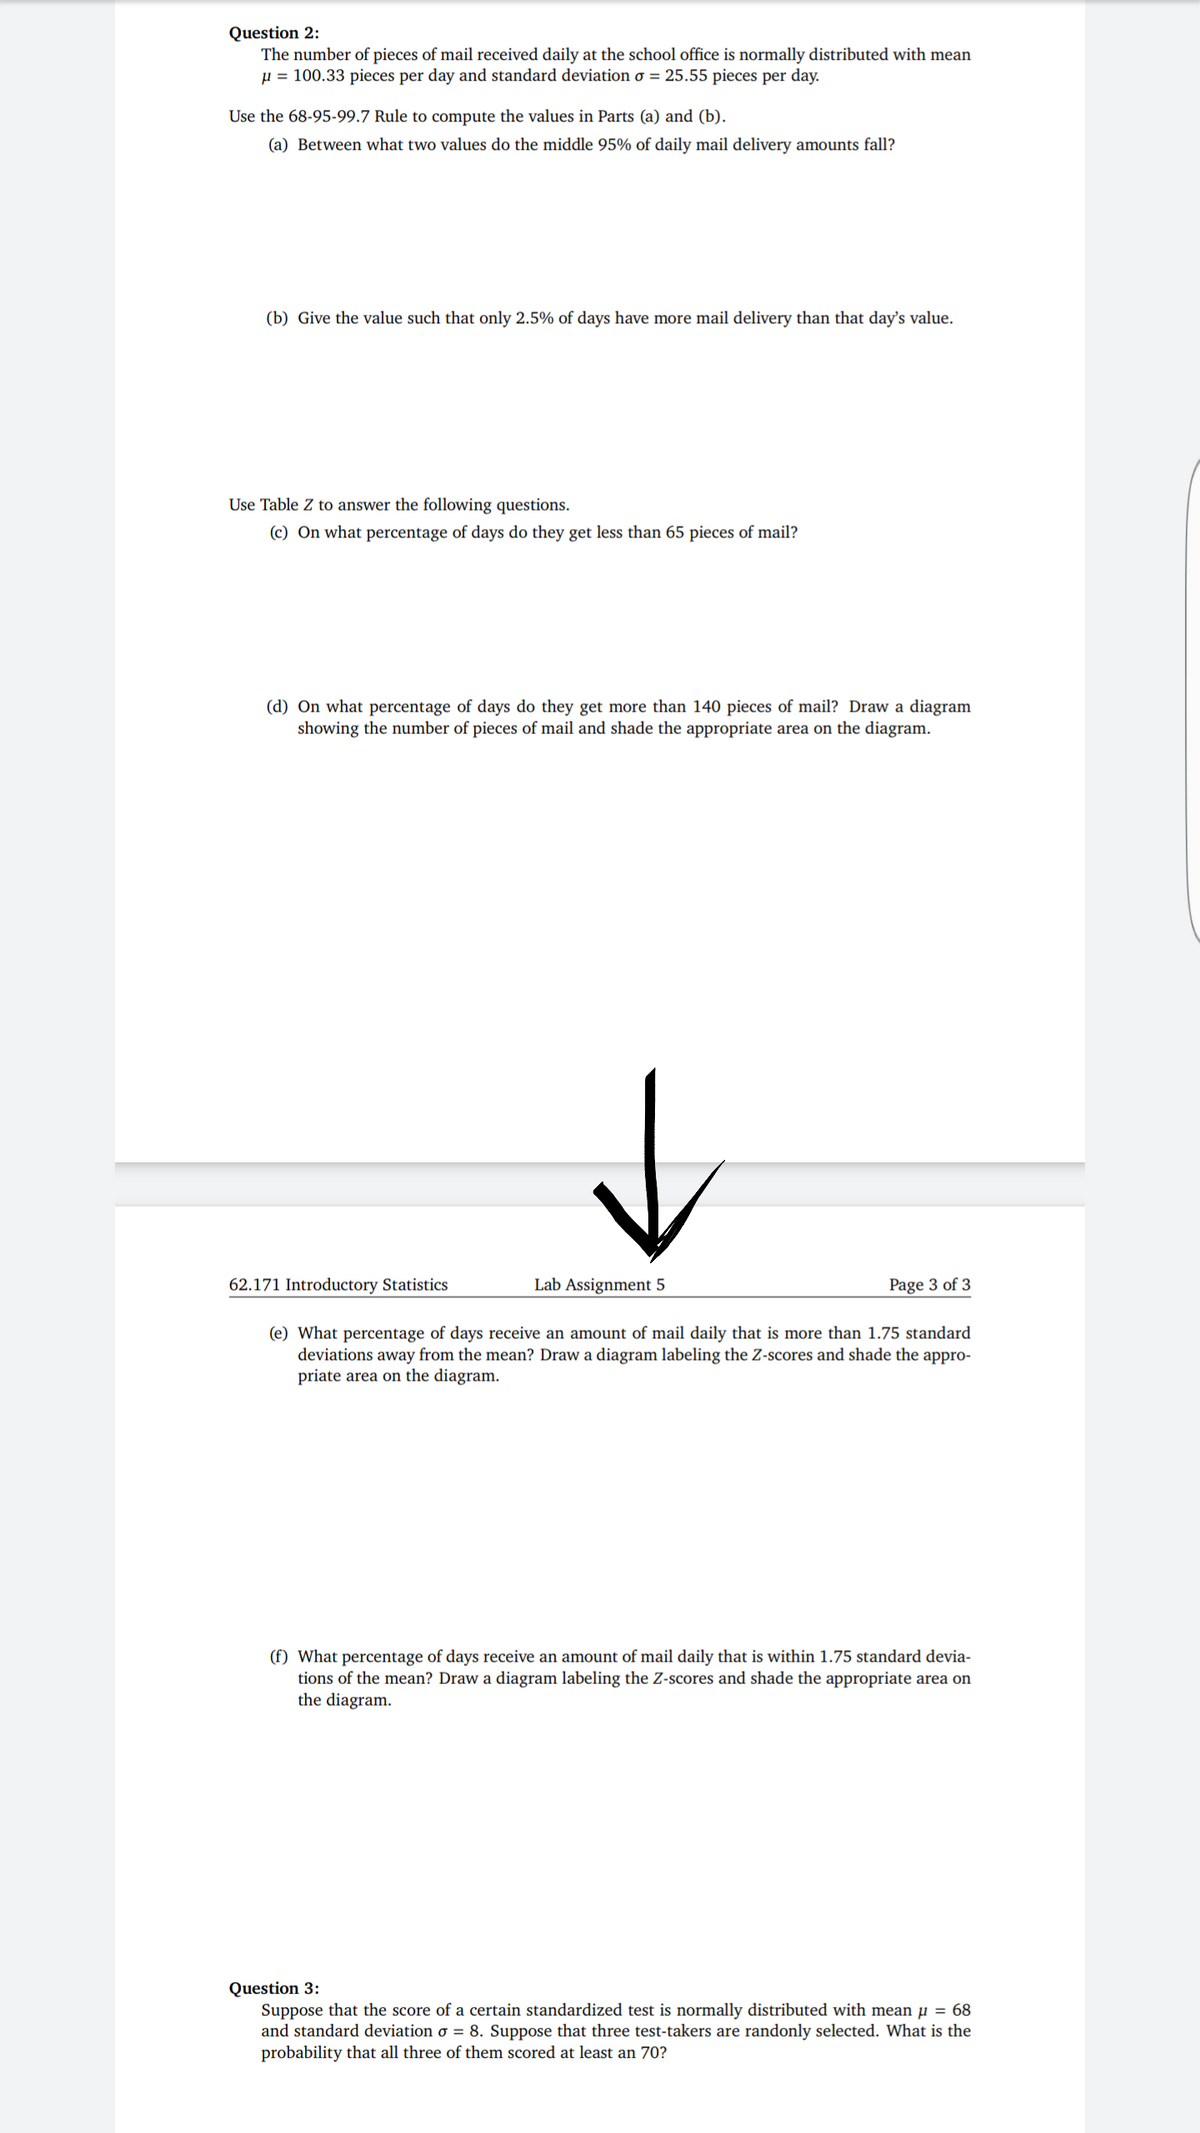
Transcribed Image Text:Question 2:
The number of pieces of mail received daily at the school office is normally distributed with mean
µ = 100.33 pieces per day and standard deviation o = 25.55 pieces per day.
Use the 68-95-99.7 Rule to compute the values in Parts (a) and (b).
(a) Between what two values do the middle 95% of daily mail delivery amounts fall?
(b) Give the value such that only 2.5% of days have more mail delivery than that day's value.
Use Table Z to answer the following questions.
(c) On what percentage of days do they get less than 65 pieces of mail?
(d) On what percentage of days do they get more than 140 pieces of mail? Draw a diagram
showing the number of pieces of mail and shade the
riate area on the
62.171 Introductory Statistics
Lab Assignment 5
Page 3 of 3
(e) What percentage of days receive an amount of mail daily that is more than 1.75 standard
deviations away from the mean? Draw a diagram labeling the Z-scores and shade the appro-
priate area on the diagram.
(f) What percentage of days receive an amount of mail daily that is within 1.75 standard devia-
tions of the mean? Draw a diagram labeling the Z-scores and shade the appropriate area on
the diagram.
Question 3:
Suppose that the score of a certain standardized test is normally distributed with mean µ = 68
and standard deviation o = 8. Suppose that three test-takers are randonly selected. What is the
probability that all three of them scored at least an 70?
Expert Solution
This question has been solved!
Explore an expertly crafted, step-by-step solution for a thorough understanding of key concepts.

This is a popular solution!

Trending now
This is a popular solution!

Step by step
Solved in 4 steps with 1 images

Knowledge Booster


Learn more about
Need a deep-dive on the concept behind this application? Look no further. Learn more about this topic, probability and related others by exploring similar questions and additional content below.Recommended textbooks for you
A First Course in Probability (10th Edition)
Probability
ISBN:
9780134753119
Author:
Sheldon Ross
Publisher:
PEARSON

A First Course in Probability (10th Edition)
Probability
ISBN:
9780134753119
Author:
Sheldon Ross
Publisher:
PEARSON