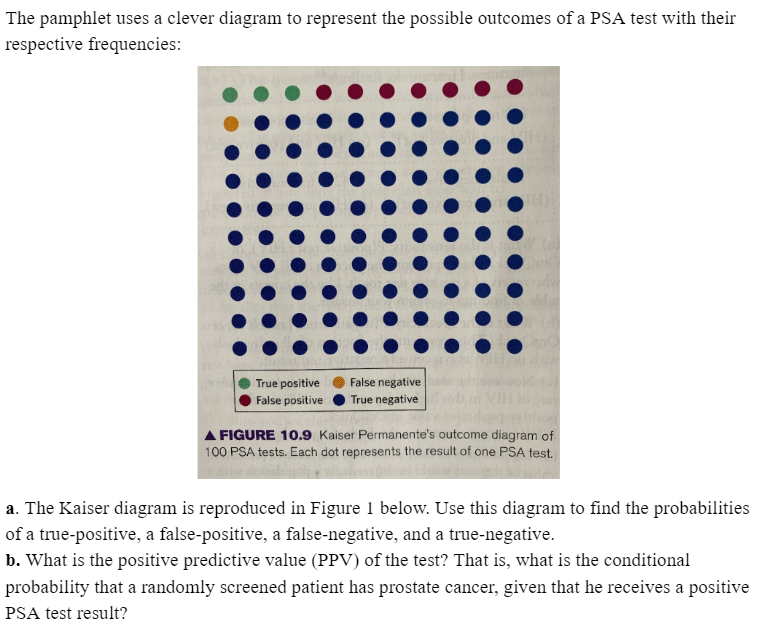
The pamphlet uses a clever diagram to represent the possible outcomes of a PSA test with their respective frequencies: True positive False negative False positive True negative A FIGURE 10.9 Kaiser Permanente's outcome diagram of 100 PSA tests. Each dot represents the result of one PSA test. a. The Kaiser diagram is reproduced in Figure 1 below. Use this diagram to find the probabilities of a true-positive, a false-positive, a false-negative, and a true-negative. b. What is the positive predictive value (PPV) of the test? That is, what is the conditional probability that a randomly screened patient has prostate cancer, given that he receives a positive PSA test result?
The pamphlet uses a clever diagram to represent the possible outcomes of a PSA test with their respective frequencies: True positive False negative False positive True negative A FIGURE 10.9 Kaiser Permanente's outcome diagram of 100 PSA tests. Each dot represents the result of one PSA test. a. The Kaiser diagram is reproduced in Figure 1 below. Use this diagram to find the probabilities of a true-positive, a false-positive, a false-negative, and a true-negative. b. What is the positive predictive value (PPV) of the test? That is, what is the conditional probability that a randomly screened patient has prostate cancer, given that he receives a positive PSA test result?

A First Course in Probability (10th Edition)
10th Edition
ISBN:9780134753119
Author:Sheldon Ross
Publisher:Sheldon Ross
Chapter1: Combinatorial Analysis
Section: Chapter Questions
Problem 1.1P: a. How many different 7-place license plates are possible if the first 2 places are for letters and...

Related questions

Question
Transcribed Image Text:The pamphlet uses a clever diagram to represent the possible outcomes of a PSA test with their
respective frequencies:
True positive
False negative
False positive
True negative
A FIGURE 10.9 Kaiser Permanente's outcome diagram of
100 PSA tests. Each dot represents the result of one PSA test.
a. The Kaiser diagram is reproduced in Figure 1 below. Use this diagram to find the probabilities
of a true-positive, a false-positive, a false-negative, and a true-negative.
b. What is the positive predictive value (PPV) of the test? That is, what is the conditional
probability that a randomly screened patient has prostate cancer, given that he receives a positive
PSA test result?
Expert Solution
This question has been solved!
Explore an expertly crafted, step-by-step solution for a thorough understanding of key concepts.

This is a popular solution!

Trending now
This is a popular solution!

Step by step
Solved in 3 steps with 3 images

Knowledge Booster


Learn more about
Need a deep-dive on the concept behind this application? Look no further. Learn more about this topic, probability and related others by exploring similar questions and additional content below.Recommended textbooks for you
A First Course in Probability (10th Edition)
Probability
ISBN:
9780134753119
Author:
Sheldon Ross
Publisher:
PEARSON

A First Course in Probability (10th Edition)
Probability
ISBN:
9780134753119
Author:
Sheldon Ross
Publisher:
PEARSON