The Party of Nonvoters From past elections, are those who are either not nonvoters registered to vote or are considered unlikely to vote in an upcoming election. Nonvoters are very different demographically from likely voters. Nonvoters are more racially and ethnically diverse. 43% of those who are not likely to cast a ballot are Hispanic, African or other racial and ethnic minorities, roughly double the percentage amoung likely voters (22%) (Source: Pew Research Center, October, 2014, "The Party of Nonvoters"). Suppose you interview 8 people who are considered nonvoters. Round answers to 4 decimal places. a.) What is the probability that 5 of them are an ethnic minority? b.) What is the probability that more than 2 are an ethnic minority? c.) What is the probability that at least 2 are not an ethnic minority? d.) What is the probability that fewer than 5 are not an ethnic minority:
The Party of Nonvoters From past elections, are those who are either not nonvoters registered to vote or are considered unlikely to vote in an upcoming election. Nonvoters are very different demographically from likely voters. Nonvoters are more racially and ethnically diverse. 43% of those who are not likely to cast a ballot are Hispanic, African or other racial and ethnic minorities, roughly double the percentage amoung likely voters (22%) (Source: Pew Research Center, October, 2014, "The Party of Nonvoters"). Suppose you interview 8 people who are considered nonvoters. Round answers to 4 decimal places. a.) What is the probability that 5 of them are an ethnic minority? b.) What is the probability that more than 2 are an ethnic minority? c.) What is the probability that at least 2 are not an ethnic minority? d.) What is the probability that fewer than 5 are not an ethnic minority:

Glencoe Algebra 1, Student Edition, 9780079039897, 0079039898, 2018
18th Edition
ISBN:9780079039897
Author:Carter
Publisher:Carter
Chapter10: Statistics
Section10.6: Summarizing Categorical Data
Problem 28PPS

Related questions
Question
Plz all 4 parts will definitely upvote
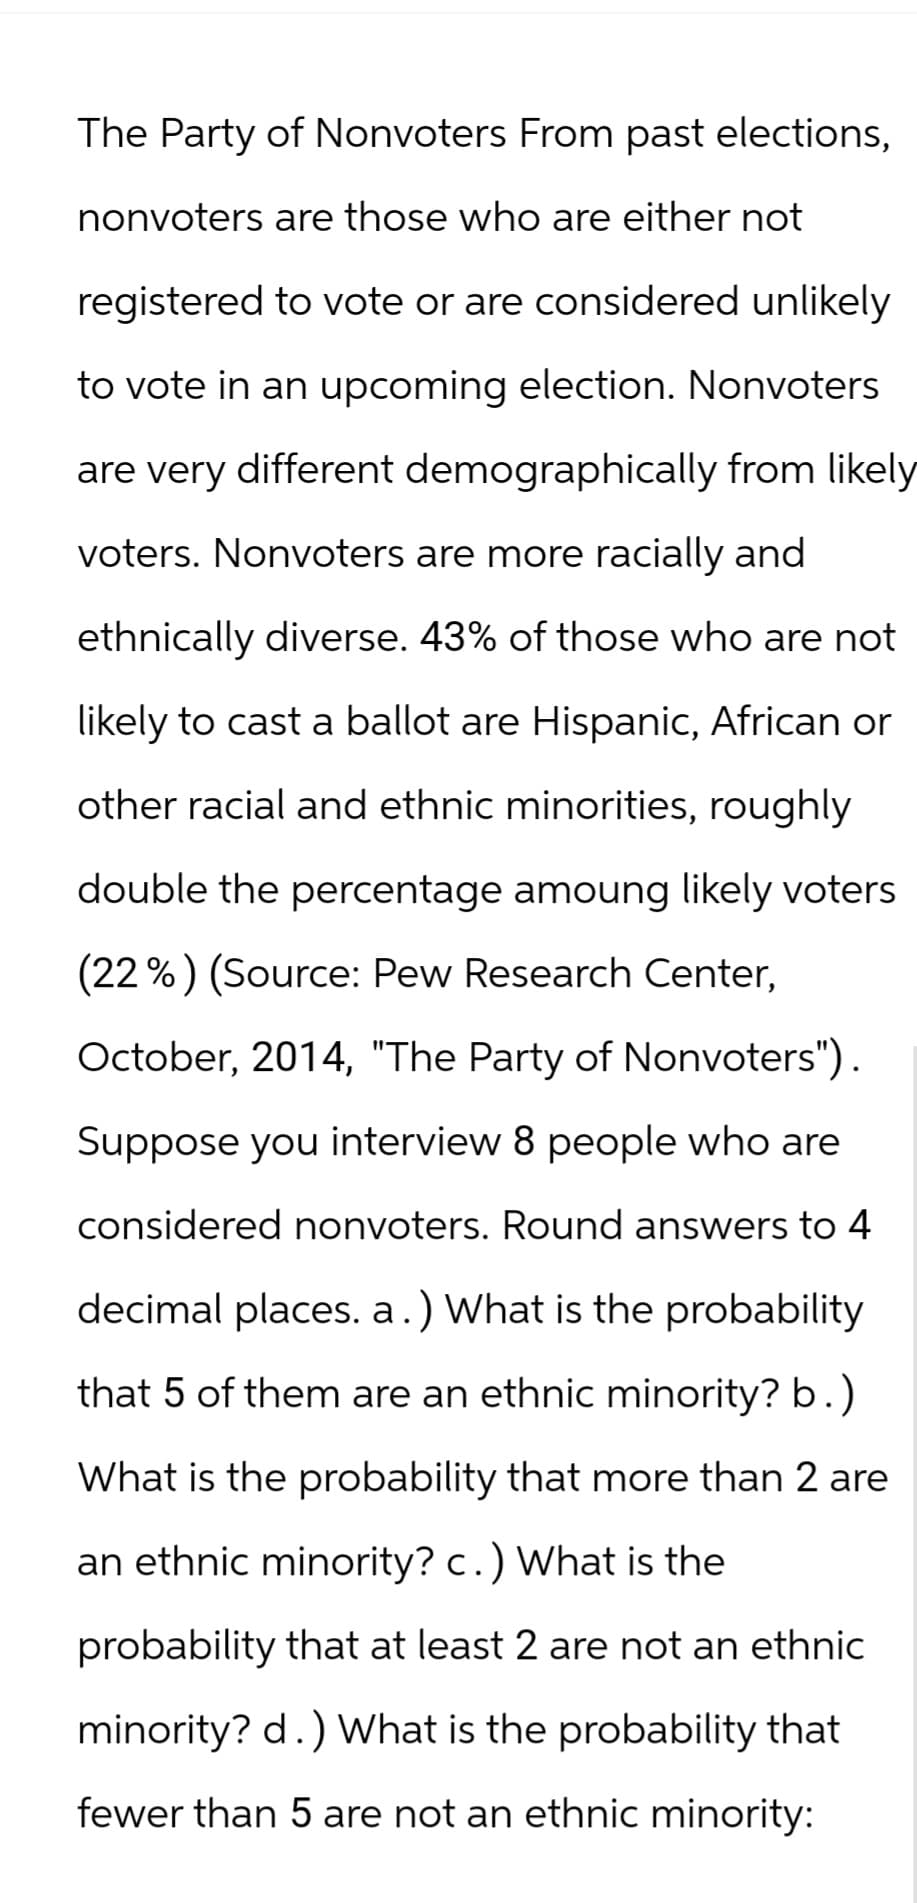
Transcribed Image Text:The Party of Nonvoters From past elections,
nonvoters are those who are either not
registered to vote or are considered unlikely
to vote in an upcoming election. Nonvoters
are very different demographically from likely
voters. Nonvoters are more racially and
ethnically diverse. 43% of those who are not
likely to cast a ballot are Hispanic, African or
other racial and ethnic minorities, roughly
double the percentage amoung likely voters
(22%) (Source: Pew Research Center,
October, 2014, "The Party of Nonvoters").
Suppose you interview 8 people who are
considered nonvoters. Round answers to 4
decimal places. a.) What is the probability
that 5 of them are an ethnic minority? b.)
What is the probability that more than 2 are
an ethnic minority? c.) What is the
probability that at least 2 are not an ethnic
minority? d.) What is the probability that
fewer than 5 are not an ethnic minority:
Expert Solution
This question has been solved!
Explore an expertly crafted, step-by-step solution for a thorough understanding of key concepts.
Step 1: Given Information:
VIEWStep 2: Find the probability that 5 are an ethnic minority:
VIEWStep 3: Find the probability that more than 2 are an ethnic minority:
VIEWStep 4: Find the probability that at least 2 are not an ethnic minority:
VIEWStep 5: Find the probability that fewer than 5 are not an ethnic minority:
VIEWSolution
VIEW
Step by step
Solved in 6 steps with 20 images

Recommended textbooks for you
Glencoe Algebra 1, Student Edition, 9780079039897…
Algebra
ISBN:
9780079039897
Author:
Carter
Publisher:
McGraw Hill


Algebra & Trigonometry with Analytic Geometry
Algebra
ISBN:
9781133382119
Author:
Swokowski
Publisher:
Cengage
Glencoe Algebra 1, Student Edition, 9780079039897…
Algebra
ISBN:
9780079039897
Author:
Carter
Publisher:
McGraw Hill
Algebra & Trigonometry with Analytic Geometry
Algebra
ISBN:
9781133382119
Author:
Swokowski
Publisher:
Cengage