The percentage of adults in the labor force ages 65 and older who are still working has risen since 1990. The table below shows the data from 1990 to 2007. Let x represent the number of years after 1990. (a) Use the method of least squares to find the best line that fits these data. (b) Estimate the percent for the year 1998. (c) If the trend determined by the straight line in part (a) continues, when will the percent reach 16.67 1990 10.3 1995 11.2 2000 12.2 2005 13.4 2007 14.6 Year % of Labor Force (a) The line is y=x+O (Type an expression using x as the variable. Use integers or decimals for any numbers in the expression. Round to the nearest thousandth as needed.)
The percentage of adults in the labor force ages 65 and older who are still working has risen since 1990. The table below shows the data from 1990 to 2007. Let x represent the number of years after 1990. (a) Use the method of least squares to find the best line that fits these data. (b) Estimate the percent for the year 1998. (c) If the trend determined by the straight line in part (a) continues, when will the percent reach 16.67 1990 10.3 1995 11.2 2000 12.2 2005 13.4 2007 14.6 Year % of Labor Force (a) The line is y=x+O (Type an expression using x as the variable. Use integers or decimals for any numbers in the expression. Round to the nearest thousandth as needed.)

Linear Algebra: A Modern Introduction
4th Edition
ISBN:9781285463247
Author:David Poole
Publisher:David Poole
Chapter7: Distance And Approximation
Section7.3: Least Squares Approximation
Problem 34EQ

Related questions
Question
new is
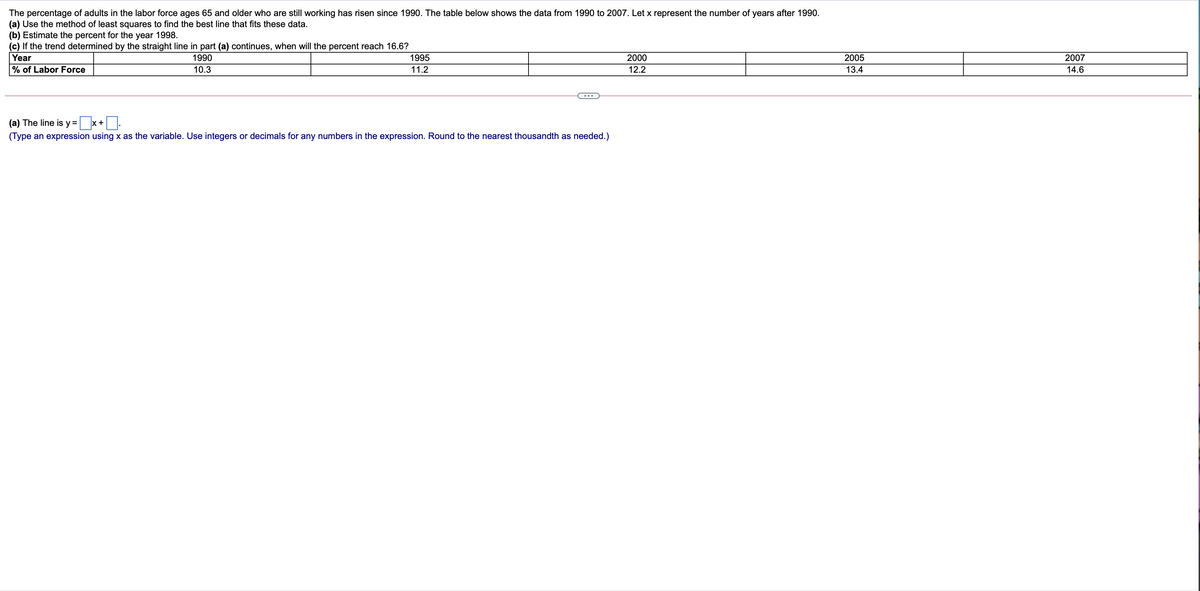
Transcribed Image Text:The percentage of adults in the labor force ages 65 and older who are still working has risen since 1990. The table below shows the data from 1990 to 2007. Let x represent the number of years after 1990.
(a) Use the method of least squares to find the best line that fits these data.
(b) Estimate the percent for the year 1998.
(c) If the trend determined by the straight line in part (a) continues, when will the percent reach 16.6?
Year
1990
1995
2000
2005
2007
% of Labor Force
10.3
11.2
12.2
13.4
14.6
...
(a) The line is y = x+
(Type an expression using x as the variable. Use integers or decimals for any numbers in the expression. Round to the nearest thousandth as needed.)
Transcribed Image Text:Next question
hber of years after 1990.
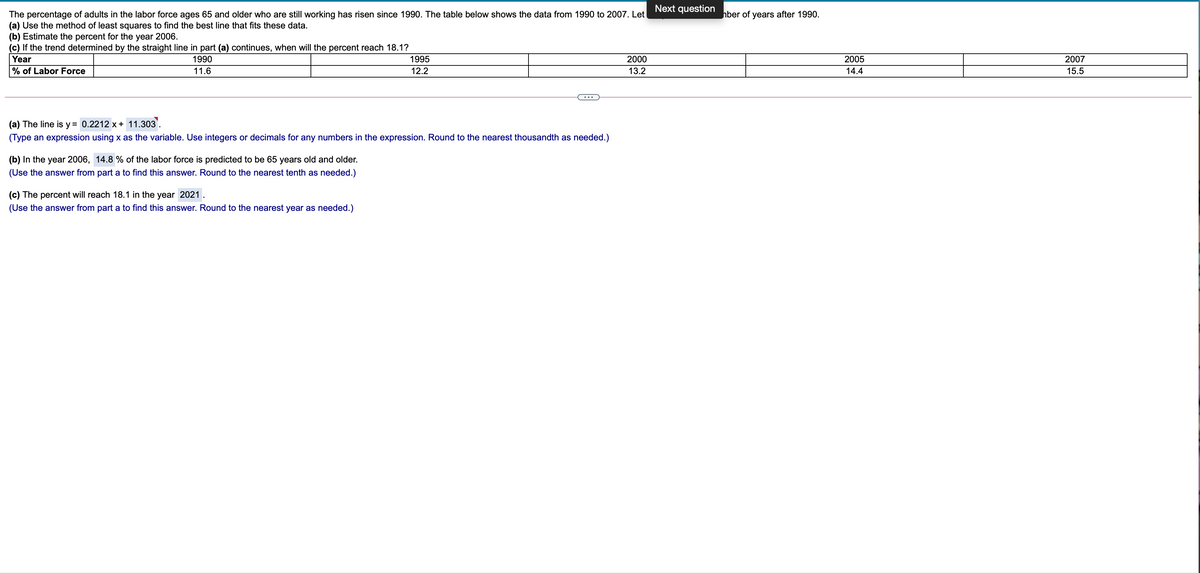
The percentage of adults in the labor force ages 65 and older who are still working has risen since 1990. The table below shows the data from 1990 to 2007. Let
(a) Use the method of least squares to find the best line that fits these data.
(b) Estimate the percent for the year 2006.
(c) If the trend determined by the straight line in part (a) continues, when will the percent reach 18.1?
Year
1990
1995
2000
2005
2007
% of Labor Force
11.6
12.2
13.2
14.4
15.5
(a) The line is y = 0.2212 x+ 11.303'.
(Type an expression using x as the variable. Use integers or decimals for any numbers in the expression. Round to the nearest thousandth as needed.)
(b) In the year 2006, 14.8 % of the labor force is predicted to be 65 years old and older.
(Use the answer from part a to find this answer. Round to the nearest tenth as needed.)
(c) The percent will reach 18.1 in the year 2021.
(Use the answer from part a to find this answer. Round to the nearest year as needed.)
Expert Solution
This question has been solved!
Explore an expertly crafted, step-by-step solution for a thorough understanding of key concepts.

This is a popular solution!

Trending now
This is a popular solution!

Step by step
Solved in 2 steps with 2 images

Recommended textbooks for you
Linear Algebra: A Modern Introduction
Algebra
ISBN:
9781285463247
Author:
David Poole
Publisher:
Cengage Learning

Algebra and Trigonometry (MindTap Course List)
Algebra
ISBN:
9781305071742
Author:
James Stewart, Lothar Redlin, Saleem Watson
Publisher:
Cengage Learning

Glencoe Algebra 1, Student Edition, 9780079039897…
Algebra
ISBN:
9780079039897
Author:
Carter
Publisher:
McGraw Hill
Linear Algebra: A Modern Introduction
Algebra
ISBN:
9781285463247
Author:
David Poole
Publisher:
Cengage Learning
Algebra and Trigonometry (MindTap Course List)
Algebra
ISBN:
9781305071742
Author:
James Stewart, Lothar Redlin, Saleem Watson
Publisher:
Cengage Learning
Glencoe Algebra 1, Student Edition, 9780079039897…
Algebra
ISBN:
9780079039897
Author:
Carter
Publisher:
McGraw Hill