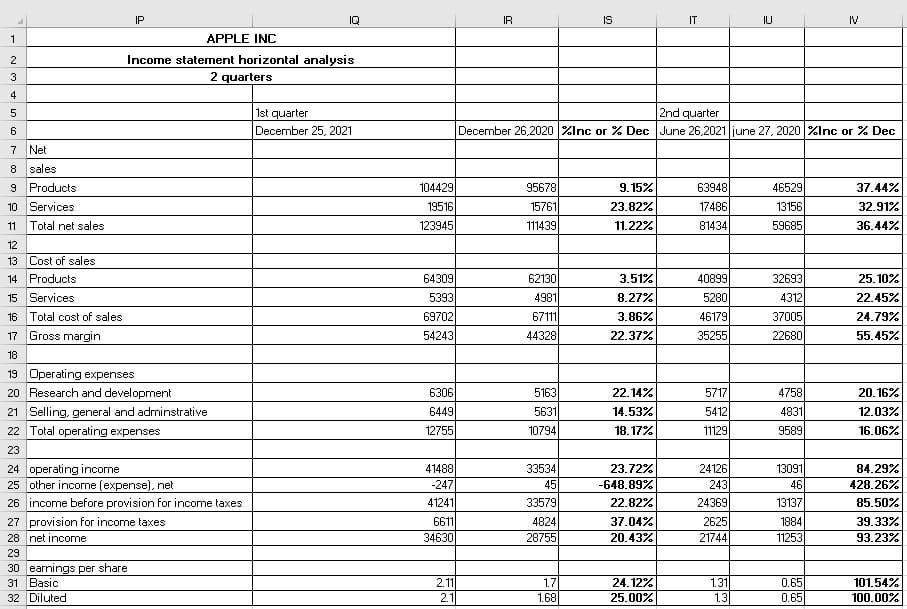
The photo given below is the horizontal analysis of Apple Inc income statement for two quotas. Discuss the analysis


Q: On July 1, KAW Inc. purchased 75 cows which, at that time were 2.5 years old for a total cost of P1,...
A: Price at which 2.5 year old cow was purchased On July 01 = P1,350,00075 cows = P18,000 per cow Gain ...
Q: Gunnison Creamery produces a variety of specialty ice creams and buys ingredients from many supplier...
A: Journal entry - It refers to the process where the business transactions are recorded in the books o...
Q: 4. Sunland Company has the following two temporary differences between its income tax expense and i...
A: The above mentioned question solution with calculation given in the following steps.
Q: а. Kimchi invested P600,000 cash in the cafe'. Cash Owners' Equity b. Kimchi purchased P3,500 in foo...
A: Solution:- Given that, Kimchi purchased a small cafe in a town with $600,000 Preparation of Kimchi T...
Q: 18,000 188,000 40,000 32,000 34,000 58,000 24,800 $ 1,134,800 expense-tquipment Salaries expense mag...
A: Income statements is prepared to calculate the profit of company. it is calculated by finding the...
Q: What is the main advantage of an object classification budget? What are its limitations? How do perf...
A: Answer: Object classification budget is the budget which is traditional system of budget and it is m...
Q: HONGTIST Co. have segment C and segment U. During the past years, 50,000 and 20, 000 were produced ...
A: The differential analysis is performed to compare the different alternatives available with the busi...
Q: The capital structure of Red Ribbon Corporation on December 31,2019 follows: 12% Preference share ca...
A: Introduction:- Preference shares, also known as preferred stock, are shares of a corporation's stock...
Q: Below is an incomplete Statement of Financial Position for a company at the end of 2020. ...
A: The question is based on the concept of Financial Accounting. As per the Bartleby guidelines we are ...
Q: 5. Onion Pub opened on 1st April and the following six transactions occurred in its first week of bu...
A: Date Particulars Amount 1 Bank A/c DR 4000 To Cash 4000 2 Inventory a/c DR 5000 ...
Q: The adjusted trial balance of Karise Repairs on December 31 follows. KARISE REPAIRS Adjusted Trial B...
A: Net income = Total Revenue - Total expenses Retained earnings , Ending balance= Retained earnings , ...
Q: SOUND CORE WIRELESS sells a variety of mobile telephone accessories including several brands of Wire...
A: Perpetual Inventory System – Under Perpetual inventory system on every sales transaction cost of goo...
Q: What is the correct order of steps in the accounting cycle?
A: Accounting is very important process used in business. The main purpose of accounting is to record a...
Q: On October 1, 2021, ABC Company paid an insurance premium covering the period from October 1, 2021 t...
A: Insurance expense per month = Total amount paid / Total period of service Prepaid Insurance Expense ...
Q: XYZ Company prepares monthly interim financial statements, The company needs to estimate the month-e...
A: Sales on account = Accounts receivables month end + Collections made in month - Accounts receivables...
Q: The manager of a fabric store has noticed a considerable increase in the amount of defective fabric ...
A: SOLUTION INCREASING FLAWS MAY RESULT IN A SIGNIFICANT LOSS FOR THE COMPANY. BECAUSE THEY ARE NOW CON...
Q: Seattle Transit Ltd. operates a local mass transit system. The transit authority is a state governme...
A: Regular far =$ 3.3 per trip Full cost = $ 5.3 per trip Senior citizen price = 63 cents per trip Also...
Q: Prepare the necessary adjusting general journal entry for December 31, 2021, to reflect the investme...
A: Journal entries refers to the official book of a company which is used to record the day to day tran...
Q: To practice how the use of debits, credits, and double entry accounting affect individual T accounts...
A: The accounting equation is written as: Assets = Liabilities + equity Equity can be calculated as : E...
Q: Social Media, Inc. (SMI) has two services for users. Toot!, which connects tutors with students who ...
A: A cost allocated to produce a product or service is called Overhead rate. Overhead costs are the ind...
Q: A CIS environment exists when a computer of any type o. size is involved in processing of an entity'...
A: Answer: CIS is defined as one of information system which is based on computer information system. T...
Q: f. Prepare journal entries on January 1,20x1, December 31, 20x1 and January 1, 20x2.
A: A Sales type lease is in the nature of a sale. Here the lessor is selling the product to the lessee....
Q: 1. On December 31, 2019, what is the consolidated net income? 2. How much is the carrying value of g...
A: William Corp has acquired 80% shares of Kate company and hence is the holding company of Kate Compan...
Q: On March 1, 2016, ASG Co. assigned its P1,900,000 accounts receivable to DXB Bank in exchange for a ...
A: solution given Date of assignment March 1 2016 Amount of account receivable assigned 190...
Q: Sabel Company purchased assembly equipment for $594,000 on January 1, Year 1. Sabel's financial cond...
A: The depreciation expense is charged on fixed assets as reduction in the value of fixed assets with u...
Q: 2,068 4,728 3,900 turns and allowances Costs of transportation-in Required: 1. Compute the company's...
A: Income Statement The purpose of preparing income statement is to know the actual net income which ar...
Q: During 2020, Mami Corp. received P8,000,000 from tenants. The balance sheet contained the following ...
A: The rent receivable from previous year was the income for that year only which is received in cash d...
Q: A temporary difference arises when a revenue item is reported for tax purposes in a period After...
A: Reason: This temporary differences occur because financial accounting and tax accounting rules ar...
Q: An accrued expense can best be described as an amount Paid and currently matched with earnings Pai...
A: Solution Concept Accrued expense Accrued expense means the expense that has already been incurred bu...
Q: ABC Company received a four-month note receivable in the amount of P74,000,000 on September 1. The n...
A: As per accrual concept any income or expenses shall be recognised only when they are earned or incur...
Q: Why are the board members of the IASB limited only to 14 people? Aren't they bombarded with workload...
A: solution concept IASB board members IASB stands for international accounting standar...
Q: Indigo Company provides the following information about its defined benefit pension plan for the yea...
A: SOLUTION CALCULATION OF PENSION EXPENSE-. SERVICE COST 91000 INTERST COST (701800*10%) 70180 ...
Q: What Does Stockholder's Equity Mean and Define the two main parts of Stockholder's Equity? (200- 300...
A: Financial statements are those statements which are prepared at the end of accounting period for the...
Q: P Corporation acquired an 80% interest in S Company on January 1, 2020 for P425,000. On this date, t...
A: Calculation of Goodwill recognized at January 1, 2020: Amount (P) Share capital 175,000 Ret...
Q: 39. A corporation has a defined-benefit plan. A pension liability will result at the end of the yea...
A: Pension obligation - projected lifetime of the former employee two types - defined benefits or def...
Q: On October 1, 2021, FDN Company paid an insurance premium covering the period from October 1, 2021 t...
A: Prepaid insurance : In some cases, the benefit of amount already spent and also paid relates to next...
Q: FDN Company acquires a building on April 1, 2021 at a cost of P26,500,000. The building has an estim...
A: Depreciation: Depreciation means the reduction in the value of an asset over the life of the assets ...
Q: 34. In a defined-contribution plan, a formula is used that defines the benefits that the employee...
A: The defined contribution plan is strategized to benefit the employees during the time of retirement....
Q: is counted only every month-end. All sales are made on account and mark up on cost is 25%. The follo...
A: Sales during June = Collections made in June + Ending accounts receivable - beginning accounts recei...
Q: 1. What amount should be reported as net income after the current year? a. 2,000,000 b. 2,500,000 ...
A: The question provides us with the summary of account balances for the year end of Empress Company. W...
Q: 9. Carla Vista Co. at the end of 2020, its first year of operations, prepared a reconciliation betwe...
A: Income tax expenses is total tax amount calculated on taxable income by effective tax rate.
Q: Iring process whe ng gold flake, are heated, mixed, and molded ir king department. The individual ca...
A: Cost of goods sold are the cost of the units sold . They are completed units that are transferred ...
Q: On March 1, AYE Merchandising had an inventory of P560,000 in its retail store. Purchases made in Ma...
A: 25% on cost equals to 20% on sales Closing stock = Opening stock + Purchases - Cost of goods sold Ma...
Q: On March 1, AYE Merchandising had an inventory of P560,000 in its retail store. Purchases made in Ma...
A: Cost of goods sold is actual cost of goods that is being sold to the customers. It includes beginnin...
Q: The photo given below is the horizontal analysis of Apple Inc balance sheet for two quotas. Discuss ...
A: Horizontal analysis is one of the financial statements analysis tool, under which increase or decrea...
Q: Northwest Company produces two types of glass shelving: rounded edge and squared edge. The company r...
A:
Q: 1
A: Loan is one of the liability of the business, which needs to be paid or settled on timely basis. Int...
Q: If a business sells $2000 worth of inventory to a customer for $3000 on credit, show all of the rele...
A: Journal entries are passed to record day to day transaction of business. To keep track of transactio...
Q: Carter, Inc. uses a traditional volume-based costing system in which direct labor hours are the allo...
A: This question is regarding computation of costs under Traditional Costing System and Activity Based ...
Q: ABC had the following net income (loss) the first three years of operation: $7,000, ($1,600), and $3...
A: The dividend is a method of distributing profit among the shareholders. It can be in the form of a c...
The photo given below is the horizontal analysis of Apple Inc income statement for two quotas. Discuss the analysis

Step by step
Solved in 2 steps


- tion 8Income statement for the year ended 31 December, 2019 of KKMTN Ghana Ltd2018 2019ȼ ‘000 ȼ ‘000Turnover 420,000 523,600Cost of sales (330,000) (417,200)Gross profit 89,000 106,400Expenses:Administration 44,600 50,200Selling and distribution 15,400 (60,000) 19,600 (69,800)Profit before interest 29,000 36,600Debenture interest - (2,800)Net profit before tax 29,000 33,800Taxation (8,000) (10,000)Net Profit after tax 21,000 23,800Ordinary dividend paid 8,400 9,250Ordinary shares issued 12 million and trading at ȼ3 each as at yesterday onGSE.You are required to compute the following investment ratios:a). Earnings per shareb). Dividend per sharec). Payout ratiod). Price earnings ratioe). Earnings yieldE23.10B (L0 1,4) (Classification of Transactions) Following are selected balance sheet accounts of BioLazer Corp. at December 31, 2020 and 2019, and the increases or decreases in each account from 2019 to 2020. Also presented is selected income statement information for the year ended December 31, 2020, and additional information. Increase Selected balance sheet accounts 2020 2019 (Decrease)AssetsAccounts receivable $154,000 $120,000 $34,000Property, plant, and equipment 631,000 581,000 50,000Accumulated…ROA=10% ROE=11.2% Current ratio=1.5 Quick ratio=0.9 gross profit margin=24% Sales=1650000 Earning available for common stock =140000 How total assets turnover?
- Price earning ratio: market price per common share/ earning per share 3388/ 42.64= 79.46 (Amazon 2020 year) 1847/ 23.46= 78.77 (Amazon 2019 year) 20.24 (Walmart 2020 year) Write financial analysis report.Current Asset 120 000Cash 20 000Accounts Receivable 45 000Short-term investments 12 000Merchandise Inventory 42 000Current Liabilities 68 000 What is the company's current ratio?What is the company's quick ratio?Microsoft HP Alaska Air Southwest Airlines Ford Motor Kellogg General Mills Volatility (standard Deviation) Correlation with 33% 37% 37% 31% 50% 20% 17% Microsoft 1.00 0.39 0.21 0.24 0.27 0.05 0.08 HP 0.39 1.00 0.28 0.35 0.27 0.11 0.06 Alaska Air 0.21 0.28 1.00 0.39 0.15 0.15 0.20 Southwest Airlines 0.24 0.35 0.39 1.00 0.30 0.15 0.22 Ford Motor 0.27 0.27 0.15 0.30 1.00 0.18 0.06 Kellogg 0.05 0.11 0.15 0.15 0.18 1.00 0.54 General Mills 0.08 0.06 0.20 0.22 0.06 0.54 1.00 Required: 1.What is the covariance between Microsoft and HP? 2. What is the covariance between General Mills and Ford? 3. What is the volatility of a portfolio with equal amounts invested in Microsoft and Hewlett-Packard stock? 4. What is the volatility of a portfolio with equal amounts invested in Microsoft and Alaska Air Stock?
- How do you calculate the TTM? Particulars 2007 2008 2009 2010 2011 2012 2013 2014 2015 2016 2017 2018 TTM Sales ₱ 32,067.00 ₱ 35,422.00 ₱ 70,881.00 ₱ 95,519.00 ₱ 122,128.00 ₱ 165,654.00 ₱ 188,793.00 ₱ 232,834.00 ₱ 263,159.00 ₱ 273,046.00 ₱ 269,693.00 ₱ 294,619.00Clinton Co. has an D Olj 10:00-00 D H 22-02-16 operating leverage of 4. Sales are expected to increase by 6% next year. Operating income is 6:2690140 20256-7 BAR 727 CO 34 Canon O 151463INCOME STATEMENT Year ended June 30 2022 2021 $'000 $'000Revenue 22450 18675Cost of sales 8475 8055Gross Profit 13975 10620Distribution costs 4245 3120Administrative expenses 1276 2134Selling expenses…
- ROA=10% ROE=11.2% Current ratio=1.5 Quick ratio=0.9 gross profit margin=24% Sales=1650000 Earning available for common stock =140000 current liabilities=60000 How inventory???1-What will be the net income? a. 72000 b. 56000 c. 16000 d. 338000 Clear my choice Question 43 Not yet answered Marked out of 1.00 Flag question Question text What will be the Gross Profit at the end of the year December 2019 a. OMR 56000 b. OMR 16000 c. OMR 338,000 d. OMR 336,000 2-What is the Gross Margin in terms of Percentage? a. 16.66 b. 16.56 c. Cannot be determined d. 20.66 3-What will be the total operating expense? a. 21500 b. 53200 c. 41200 d. 19700 4-What will be the total Selling and distribution expense? a. 41200 b. 19700 c. 14800 d. 17200ccounting Assume the following sales data for a company: 2026 $734000 2025 655500 2024 570000 If 2024 is the base year, what is the percentage increase in sales from 2024 to 2025? 129% 29% 115% 15%