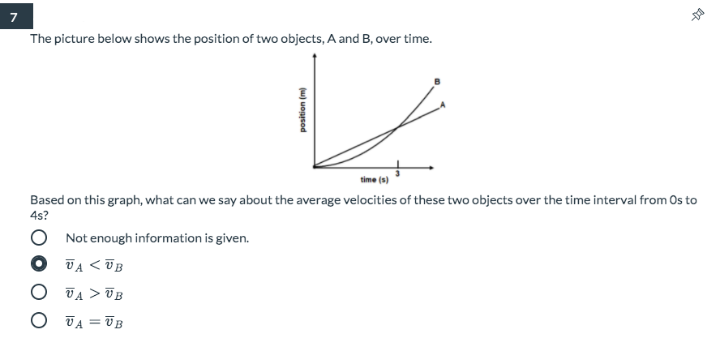
The picture below shows the position of two objects, A and B, over time. time (s) Based on this graph, what can we say about the average velocities of these two objects over the time interval from Os to 4s? O Not enough information is given. O TA UB O TA = TB w uogcod

Q: Show that ugr correctly represents the velocity of the particle both relativistically and classicall...
A: For non-relativistic case: ugr=dEdp=ddpp22m ∵E=p22m=2p2m=pmugr=v Therefore, in no...
Q: A 1.0-cm-wide diffraction grating has 1000 slits. It is illuminated by light of wavelength 550 nm. W...
A:
Q: question in the picture
A: Since the ball is rolling we can neglect friction. let m be the mass of the ball. N is the normal f...
Q: Why doesn’t the total energy of a collection of fermions approach zero as the temperature approaches...
A: Consider electrons in bands. As the temperature approaches zero, the electrons move into lowest non-...
Q: What does the Doppler Effect in Sound prove or concludes?
A: The change in frequency due to the motion of the source or receiver is called the Doppler effect. Th...
Q: A car traveling in a straight line with an initial velocity of 8.8m/s accelerates at a rate of 3.0m/...
A: Given: Initial velocity, u = 8.8 m/s Final velocity, v = 23.8 m/s Acceleration, a = 3 m...
Q: Consider a wave packet having the product ∆p ∆x = h at a time t = 0. What will be the width of such ...
A:
Q: Switch
A:
Q: Please do D, E, and F
A: Hello. Since your question has multiple sub-parts, we will solve first three sub-parts for you. If y...
Q: 5. Write the steps of calculation in detail As shown in the following figure, the negative charge Q;...
A: Given: The magnitude of the charge Q1 = - 0.5 μ C The point P at (0.3m,0.4m)
Q: A ball is hanging from a long string that is tied to the ceiling of a train car traveling eastward o...
A: The train is moving with uniform velocity with respect to the ground. The rate of change of velocity...
Q: Vector A⃗ A→ has a magnitude 5.00 and points in a direction 44.9° clockwise from the negative yyy ax...
A: The x component of the vector A is as follows: Ax=-AsinθAx=-5.00sin44.9°Ax=-3.53 ...
Q: A 30-kg box is being pushed along a horizontal smooth surface. The pushing force is 10 N directed at...
A: Given mass of box m=30kg Acting force F=10N at angle θ= 25⁰
Q: A rocket carrying a satellite is accelerating straight up from the earth’s surface. At 1.15 s after ...
A: (a) magnitude of average velocity during the 4.75 s part of the flight vavg=y2-y1∆t21=1.00 km103 m1 ...
Q: A 754g ball starts from rest and slides down a frictionless, elevated ramp. When it leaves the botto...
A:
Q: Two Capacitors are in series and connected to a 35.2 V battery. C1=229 μF and C2=632 μF. What is the...
A: The charge in series circuit is same, the effective capacitance of the circuit is, C=229 μF632 μF229...
Q: In the early 1900s, Robert Millikan used small charged droplets of oil, suspended in an electric fie...
A: Force on the drop of oil due to the electric field will be, Here, FE denotes the force, q denotes t...
Q: Please answer all parts of question 1. I appreciate it!
A: Given: θ=55.00 Horizontal distance is x=18.0m Vertical distance is y=8.00m Let v0 is the initial vel...
Q: I need it quick. ASAP
A:
Q: Quarks and gluons are fundamental particles. A proton, which is a bound state of two up quarks and a...
A: Given mp = 1.67×10⁻²⁷ kgmu = 4.12×10⁻³⁰ kgmd = 8.59×10⁻³⁰ kg
Q: Situation 7. The L-shaped bar is supported by a bearing at A and rests on a smooth horizontal surfac...
A: Given: The vertical force F = 4 kN. The distance of the force from the corner of the bar b = 0.15 m...
Q: A particle initially has a speed of 0.5c. At what speed does its momentum increase by (a) 1%, (b) 10...
A: The ratio of initial and final momentum is pfinalpinitinl=η=mγfinalvfinalmγinitialvinitalη=vfinalvin...
Q: Bose-Einstein condensates of rubidium have reached temperatures of 20 nK. Treating rubidium as an id...
A: Given: Temperature of rubidium TR = 20 nK. Lowest measured temperature of sodium TS = 450 pK.
Q: Please do A, B, and C
A: a. a+^=mω2hx^-imωp^ b. We have, a^=mω2hx^+imωp^a+^=mω2hx^-imωp^ Now, adding, a+^+a^=mω2hx^-imωp^...
Q: for y d €0 The answer is V - (у — d) for result, use this potential next. €0 (OV+ OV3 + V E) for y ...
A: 6.(a) Given: The potential is given by V=σε0y y<00 ...
Q: A certain atom requires 3.0 eV of energy to excite an electron from the ground level to the first ex...
A: Given: The difference in energy levels between the ground state and the excited state is ∆E=3 eV E...
Q: Two capacitors, C1=4uF and C2=7uF, are connected in series with a 20V battery. The battery is remove...
A: When the capacitors are connected in series, the charge in the individual capacitors is same as the ...
Q: A transparent rod 30.0 cm long is cut flat at one end and rounded to a hemispherical surface of radi...
A: Given: The length of the road L = 30 cm. The radius of the rounded end of the rod r = 10 cm. The di...
Q: What are the the main objectives and purposes of e/m electron experiment?
A: The main objectives and purposes of e/m electron experiment are explained as below,
Q: (a) What is the heat capacity Cv of a three-dimensional cubic lattice of atoms at room temperature? ...
A: (a) Introduction: Heat capacity or thermal capacity is a physical property of matter, defined as the...
Q: Let the total number of neutrons be Nn, the number of protons be Np, and N = Nn + Np. Let the fracti...
A: Given Let the total number of neutrons be Nn, the number of protons be Np, and N = Nn + Np. Let the ...
Q: Doubling the frequency of a wave in the range of 25 Hz to 3 kHz represents what change in the maximu...
A:
Q: An object with mass m2 = 50.0[kg] is on a ledge with a coefficient of kinetic friction of 0.350. It ...
A: Given: Mass m1=90.0kg Mass m2=50.0kg Coefficient of kinetic friction is μk=0.350 Free body diagram: ...
Q: An airplane’s compass indicates that it is headed due north, and its airspeed indicator shows that i...
A:
Q: A concave mirror has a radius of curvature of 34.0 cm. (a) What is its focal length? (b) If the mirr...
A: Given: The radius of curvature is R=34.0 cm. The refractive index of water is n=1.33. Part (a) The...
Q: For a convex spherical mirror that has focal length f = -12.0 cm, what is the distance of an object ...
A: Given: Focal length of convex spherical mirror f = -12.0 cm. Height of the image is half the heigh...
Q: State the advantages of choosing the phase space to be spanned by the configuration coordinate and t...
A: Introduction: A phase space is a space in which all possible states of a system are represented, wit...
Q: *PLEASE ANSWER Question #4* 1) A car is waiting at a stoplight. The car has a mass of 1200 kg. What ...
A: 1) Given: Mass of the car = 1200 kg
Q: You have just landed on Planet X. You release a 100 g ball from rest from a height of 10.0 m and mea...
A: Given Mass = 100 g Height = 10.0 m Time = 3.40 s
Q: A jet flying at an altitude of 8.50 km has a speed of Mach 2.00, where the speed of sound is v = 340...
A: The Mach number is the speed of the source divided by the speed of sound. The mach number is M=vsv(1...
Q: Write legibly and show complete solutions shown diagrams A motor stunt driver tries to pull off an e...
A: A motor stunt driver tries to pull off an exhibition by taking off an inclined ramp 53o above the ho...
Q: What are the main purpose and objective of the electron to charge mass ratio experient?
A: Given information: We have to explain the main purpose and objectives of the electron charge to mass...
Q: There are three parts a, b and c please answer all
A:
Q: Calculate the electron velocity in the 50-GeV beam at SLAC.
A: Given: The energy of the electron is 50 GeV. Introduction: The kinetic energy of an object is the en...


Trending now
This is a popular solution!

Step by step
Solved in 3 steps with 13 images
