The polulation of a certain town, as obtained from the census data, is shown in the following table. Year = x 1921 1931 1941 1951 1961 Population in thousand = y 19.96 39.65 58.87 77.21 94.61
The polulation of a certain town, as obtained from the census data, is shown in the following table. Year = x 1921 1931 1941 1951 1961 Population in thousand = y 19.96 39.65 58.87 77.21 94.61

A First Course in Probability (10th Edition)
10th Edition
ISBN:9780134753119
Author:Sheldon Ross
Publisher:Sheldon Ross
Chapter1: Combinatorial Analysis
Section: Chapter Questions
Problem 1.1P: a. How many different 7-place license plates are possible if the first 2 places are for letters and...

Related questions
Question
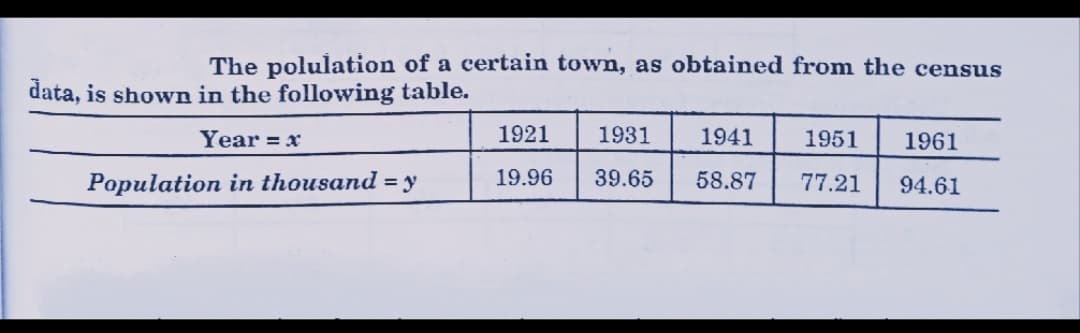
Transcribed Image Text:The polulation of a certain town, as obtained from the census
data, is shown in the following table.
Year = x
1921
1931
1941
1951
1961
Population in thousand = y
19.96
39.65
58.87
77.21
94.61
Expert Solution
This question has been solved!
Explore an expertly crafted, step-by-step solution for a thorough understanding of key concepts.

This is a popular solution!

Trending now
This is a popular solution!

Step by step
Solved in 2 steps with 1 images

Recommended textbooks for you
A First Course in Probability (10th Edition)
Probability
ISBN:
9780134753119
Author:
Sheldon Ross
Publisher:
PEARSON

A First Course in Probability (10th Edition)
Probability
ISBN:
9780134753119
Author:
Sheldon Ross
Publisher:
PEARSON