The population of a small country by year is shown in the table below. Year 1960 1955 284496 Population 367825 • The absolute change in the between 1960 and 1965 is: 83329 The percentage change in the population between 1960 and 1965 is: 77.3 The average rate of change in the population between 1960 and 1965 is: Interpolate to predict the population of the state in 1963. • Interpolate to predict the population of the state in 1968. • Extrapolate to predict the population of the state in 1977. 1965 510844 679471 people (Round your answer to ong decimal place) people per year (Give your exact answer) people (Round to the nearest whole number) people (Round to the nearest whole number) people (Round to the nearest whole number)
The population of a small country by year is shown in the table below. Year 1960 1955 284496 Population 367825 • The absolute change in the between 1960 and 1965 is: 83329 The percentage change in the population between 1960 and 1965 is: 77.3 The average rate of change in the population between 1960 and 1965 is: Interpolate to predict the population of the state in 1963. • Interpolate to predict the population of the state in 1968. • Extrapolate to predict the population of the state in 1977. 1965 510844 679471 people (Round your answer to ong decimal place) people per year (Give your exact answer) people (Round to the nearest whole number) people (Round to the nearest whole number) people (Round to the nearest whole number)

Linear Algebra: A Modern Introduction
4th Edition
ISBN:9781285463247
Author:David Poole
Publisher:David Poole
Chapter4: Eigenvalues And Eigenvectors
Section4.6: Applications And The Perron-frobenius Theorem
Problem 22EQ

Related questions
Question
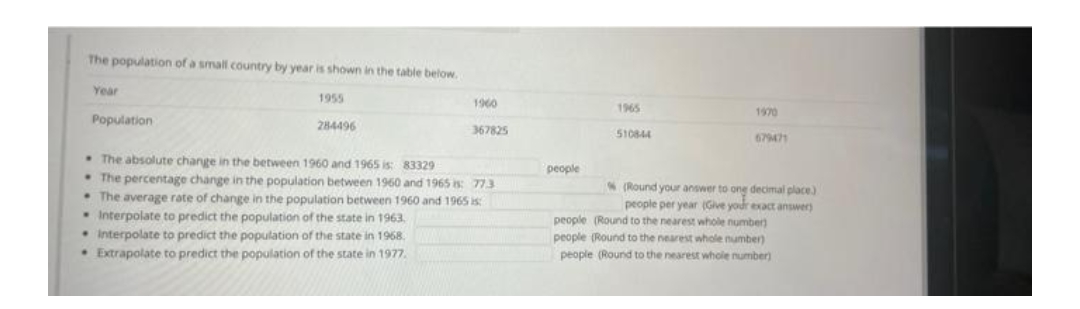
Transcribed Image Text:The population of a small country by year is shown in the table below.
Year
1960
1955
284496
Population
367825
The absolute change in the between 1960 and 1965 is: 83329
The percentage change in the population between 1960 and 1965 : 773
• The average rate of change in the population between 1960 and 1965 is:
Interpolate to predict the population of the state in 1963.
• Interpolate to predict the population of the state in 1968.
• Extrapolate to predict the population of the state in 1977.
1965
1970
510844
679471
(Round your answer to o
ong decimal place)
people per year (Give your exact answer)
people
people (Round to the nearest whole number)
people (Round to the nearest whole number)
people (Round to the nearest whole number)
Expert Solution
This question has been solved!
Explore an expertly crafted, step-by-step solution for a thorough understanding of key concepts.

Step by step
Solved in 3 steps

Recommended textbooks for you
Linear Algebra: A Modern Introduction
Algebra
ISBN:
9781285463247
Author:
David Poole
Publisher:
Cengage Learning

Big Ideas Math A Bridge To Success Algebra 1: Stu…
Algebra
ISBN:
9781680331141
Author:
HOUGHTON MIFFLIN HARCOURT
Publisher:
Houghton Mifflin Harcourt

Glencoe Algebra 1, Student Edition, 9780079039897…
Algebra
ISBN:
9780079039897
Author:
Carter
Publisher:
McGraw Hill
Linear Algebra: A Modern Introduction
Algebra
ISBN:
9781285463247
Author:
David Poole
Publisher:
Cengage Learning
Big Ideas Math A Bridge To Success Algebra 1: Stu…
Algebra
ISBN:
9781680331141
Author:
HOUGHTON MIFFLIN HARCOURT
Publisher:
Houghton Mifflin Harcourt
Glencoe Algebra 1, Student Edition, 9780079039897…
Algebra
ISBN:
9780079039897
Author:
Carter
Publisher:
McGraw Hill