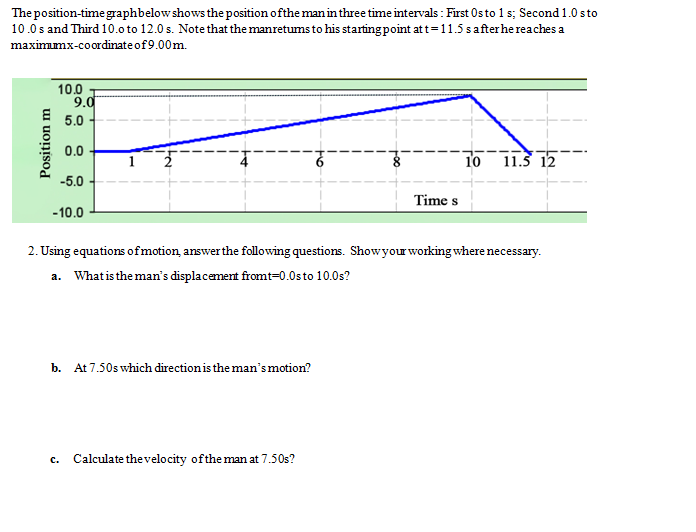
The position-time graphbelow shows the position of the man in three time intervals: First Os to 1 s; Second 1.0 sto 10.0s and Third 10.0 to 12.0 s. Note that the manreturns to his starting point at t= 11.5 s after he reaches a maximumx-coordinate of 9.00m. Position m 10.0 9.0 5.0 0.0 -5.0 -10.0 1 Time s 10 11.5 12 2. Using equations of motion, answer the following questions. Show your working where necessary.
The position-time graphbelow shows the position of the man in three time intervals: First Os to 1 s; Second 1.0 sto 10.0s and Third 10.0 to 12.0 s. Note that the manreturns to his starting point at t= 11.5 s after he reaches a maximumx-coordinate of 9.00m. Position m 10.0 9.0 5.0 0.0 -5.0 -10.0 1 Time s 10 11.5 12 2. Using equations of motion, answer the following questions. Show your working where necessary.

Related questions
Question
USE LATEX
Transcribed Image Text:The position-time graph below shows the position of the man in three time intervals: First Os to 1 s; Second 1.0 sto
10.0s and Third 10.0 to 12.0 s. Note that the manretums to his starting point at t=11.5 s after he reaches a
maximumx-coordinate of 9.00m.
Position m
10.0
9.0
5.0
0.0
-5.0
-10.0
b. At 7.50s which direction is the man's motion?
Time s
C. Calculate the velocity of the man at 7.50s?
10
2. Using equations of motion, answer the following questions. Show your working where necessary.
a. What is the man's displacement fromt=0.0s to 10.0s?
11.5 12
Expert Solution
This question has been solved!
Explore an expertly crafted, step-by-step solution for a thorough understanding of key concepts.

Step by step
Solved in 2 steps
