The probability value (P-value) for this test is _______. Based on the P-value, a 0.0311 Reject H₀. Conclude IMA LDL level is higher than the national rate. b 0.0518 Reject H₀. Conclude IMA LDL level is higher than the national rate. c 0.0863 Do not reject H₀. Do not conclude IMA LDL level is higher than the national rate. d 0.1438 Do not reject H₀. Do not conclude IMA LDL level is higher than the national rate.
Q: 1.) Three dice are rolled. Find the probability of getting three 2s if it is known that the sum of…
A:
Q: The following items represent the number of birds observed at a given feeder over the past several…
A: Mode : Mode is the number in the data set that occurred most frequently
Q: Find the marginal probability mass functions of X and Y . (b) Suppose Z and W are independent…
A:
Q: (a) If 4 balanced coins are tossed simultaneously (or 1 balanced coin is tossed 4 times), compute…
A: "Since you have asked multiple questions, we will solve the first question for you. If you want any…
Q: If A and B are complements, then which of the following is true about the probability of B based on…
A:
Q: Two students are randomly selected from a statistics class, and it is observed whether or not they…
A:
Q: 10. Suppose X and Y are a continuous bivariate random variable with 0SXS1 and0SYS2 and valid joint…
A: here given joint pdf of x and y f(x,y) = c(1 + x/2 + y/4) where 0 ≤ x ≤1 and 0 ≤y≤2
Q: The Wilson family had 9 children. Assuming that the probability of a child being a girl is 0.5, find…
A: Let X be the number of girl child follows Binomial distribution with n=9 and probability of girl…
Q: Customers enter a department store at random at an average rate of six per minute. Determine the…
A: Customers enter a department store at random at an average rate of six per minute. Determine the…
Q: Ina 52-deck card, what is the probability of having an ace or a king for the two cards that are…
A:
Q: 13. Compute the test statistic. A. 0.55 B. 1.50 C. 1.59 D. 1.60 14. Determine the critical value. A.…
A: For the given data Perform t test for one mean
Q: An anthropologist wishes to estimate the average height of the inhabitants of a certain region. If…
A: Obtain the probability that the difference between the sample mean and true population mean will not…
Q: Suppose that Y is a random variable that takes on only integer values 1, 2, ... and has distribution…
A:
Q: QUESTION 2 If S = {a,b,c} with P(a) = 4P(b) = 6P(c), find P(c).
A:
Q: 3. The row of Pascal's Triangle that corresponds to n = 8 is as follows: 1 8 28 56 70 56 28 8 1.…
A:
Q: A bag contains five red marbles, two orange marbles, one yellow marble, and two green marbles. Two…
A: Ans - A bag contains five red marbles, two orange marbles, one yellow marble, and two green marbles.…
Q: For items 10-15, refer to this word problem: In one research, the average height of Filipinos is…
A: Thank you for posting the question. As your question has more than 3 parts, as per the policy, we…
Q: If two events, A and B, are such that P(A) = 0.4, P(B) = 0.2, and P(A N B) = 0.1, find the…
A:
Q: When playing the game Clash of ClansM, RedArmy6 has earned 3 stars during 9 of her last 65 war…
A: Suppose a random experiment E is repeated n times under same essential conditions and an even A,…
Q: mic excuse for inaction. ducing greenhouse gases are negative since there is a l creases the…
A: It is given that the expected BCA and the climate change as,
Q: 36-45. The scores of Miss World candidates from seven judges were recorded as follows: 8.45, 9.20,…
A: As per company guidelines I solved only First questions.thank you
Q: : 1. does not favor the use of nuclear power 2. is a Republican/Republican leaner 3. favors the use…
A: AS PER GUIDELINES I HAVE CACLULATED 3 SUPARTS , PLZ REPOST WITH NOTE I NEDD THIS THIS .... 71 % of…
Q: What is the expectation of X where X is a single roll of a fair 6-sided dice (S {1,2, 3, 4, 5, 6})?…
A:
Q: Exercise 5. A list of 40 number is arranged in increasing order wi < w2 < <W40 · Which of following…
A:
Q: A girl has 7 pairs of gloves in her drawer, one of each color of the rainbow. How many socks does…
A: "Since you have asked multiple questions, we will solve the first question for you. If you want any…
Q: Consider the following decisions. a) You are trying to decide whether or not to go on a blind date.…
A:
Q: 18. An engineering company has four openings and the applicant pool consists of 6 database…
A:
Q: A synoptic uses Bernoulli random variable X to describe the weather conditions within one year…
A:
Q: In roulette, a wheel is divided up into slots of equal area. each slot is labeled with one of the…
A:
Q: A car insurance company has n = 1600 policy holders. The expected claim paid to a policy holder…
A:
Q: Find the number of possible four-letter code words, selecting from the 26 letters in the alphabet,…
A: From the provided information, Total letters = 26 Four letter code words is formed.
Q: In a management trainee program, 80% of the trainees are female, while 20% are male. Ninety percent…
A: Solution-: Given: P(Female)=0.80 (Or 80%) P(Male) =0.20 (Or 20%) P(Female/ Attend…
Q: A pair of dice is tossed. If one die shows a 5, what is the probability that the other due shows a 5…
A:
Q: et X,, X2, X3, X, X5, and X, denote the numbers of blue, brown, green, orange, red, and yellow M&M…
A: X1.... X6 Color wise probability given We have to answer for mentioned questions. It will be solved…
Q: how many ways can a committee of three men and four women can be formed from a group of nine men and…
A: Given data, No of men =9 No of women =6 In how many ways can a committee of three men and four…
Q: The probability that two or three of the peoplo in the group are in thoir twenties is (Round to four…
A:
Q: expected value of the drawing if 1000 tickets are sold for $5 each a person purchases one ticket.
A: here given 1000 tickets are sold , and selling price of ticket is $5
Q: roll a fair 7-sided die 5 times, what is the probability that none of the rolls are 3's or 4's? If…
A: Given that a fair 7-sided die rolled 5 times. When tossing 7-sided die, the probability of getting…
Q: The average height of grade 11 female students of a certain college is approximately normally…
A:
Q: The gestation period of humans follows a normal distribution with a mean of 266 days and a standard…
A:
Q: 2.) Find the probability that an event E will occur if odds are 5:2 in favor of E.
A:
Q: On average, based on past records, a Forklift will have a failure rate once every 7000 hours of…
A:
Q: 2. The blood groups of 200 people are distributed as follows: 40 have type A blood, 75 have type B…
A: Hey there! Thank you for posting the question. Since there are multiple questions posted, we will…
Q: 2. 4. 4. 3. 6.
A: x Frequency (f) f⋅x f⋅x2=(f⋅x)×(x) 2 2 4 8 3 4 12 36 4 3 12 48 5 1 5 25 6 0 0 0 Total…
Q: How many different three-digit numbers can be formed using the digits 1, 4, 5, and 9 without…
A: Given N=4 n=3
Q: A staff car park at the university has 22 parking spaces in a row. There are 19 cars to be parked.…
A:
Q: uestion A fair die is tlirown five times. Let X be the tandom variable "namber of gethng an even…
A:
Q: Exposure to microbial products, especially endotoxin, may have an impact on vulnerability to…
A: Mean is calculate by adding all the observation in the sample divide by the sample size. It provide…
Q: Suppose that a license plate consists of three uppercase letters followed by three digits. How many…
A: HERE AS PER GUIDELINES I HAVE CALCULATED FIRST MAIN QUESTION here use counting principle
Q: An article suggests that substrate concentration (mg/cm³) of influent to a reactor is normally…
A: GivenMean(μ)=0.30standard deviation(σ)=0.07
25 | The probability value (P-value) for this test is _______. Based on the P-value, |
a | 0.0311 | Reject H₀. Conclude IMA LDL level is higher than the national rate. | |||||||
b | 0.0518 | Reject H₀. Conclude IMA LDL level is higher than the national rate. | |||||||
c | 0.0863 | Do not reject H₀. Do not conclude IMA LDL level is higher than the national rate. | |||||||
d | 0.1438 | Do not reject H₀. Do not conclude IMA LDL level is higher than the national rate. | |||||||
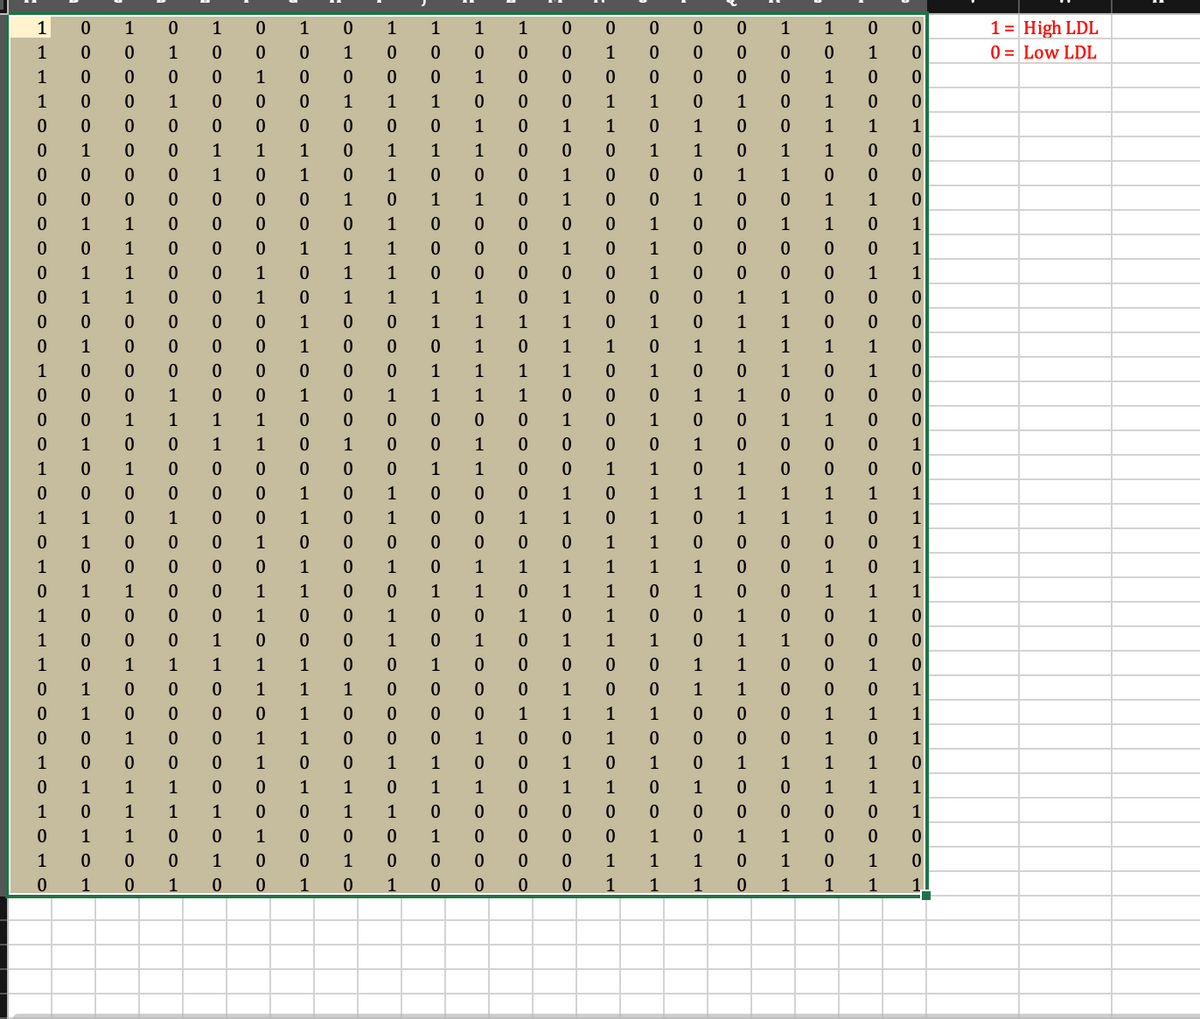
Step by step
Solved in 2 steps
- Albone Age(Rings) Shell Weight(g) 10 0.205 11 0.285 9 0.09 10 0.16 8 0.135 11 0.285 12 0.26 12 0.345 10 0.165 17 0.41 11 0.2425 13 0.34 12 0.62 10 0.3 12 0.245 13 0.31 11 0.18 12 0.125 9 0.07 11 0.26 15 0.45 10 0.205 9 0.075 19 0.345 7 0.08 13 0.33 22 0.27 12 0.35 10 0.25 10 0.105 10 0.2 20 0.4 18 0.385 19 0.285 11 0.24 17 0.625 17 0.3 17 0.37 15 0.365 3 0.01 9 0.11 8 0.027 13 0.22 20 0.415 11 0.2 12 0.36 4 0.012 15 0.14 6 0.055 5 0.025 12 0.09 12 0.245 11 0.295 9 0.123 7 0.03 13 0.255 8 0.06 20 0.525 9 0.07 13 0.3 12 0.256 6 0.03 7 0.0745 9 0.1465 9 0.202 10 0.33 11 0.3685 10 0.4 6 0.0245 5 0.045 6 0.1 7 0.119 6 0.17 8 0.156 8 0.202 7 0.214 9 0.274 9 0.315 8 0.336 11 0.4005 4 0.0095 6 0.0405 7 0.1045 7 0.1175 6 0.1385 9 0.169 8 0.206 8 0.265 9 0.292 9 0.332 8 0.34 11 0.4525 11 0.586 7 0.048 7…x y 1.0 10.0 2.0 9.0 3.0 8.0 4.0 7.0 5.0 6.0 6.0 5.0 7.0 4.0 8.0 3.0 9.0 2.0 10.0 1.0 y 1 2 3 4 5 6 7 8 9 10 11 x 1 2 3 4 5 6 7 8 9 10 11 0 Figure 1 u v 1.0 7.7 2.0 5.4 3.0 10.3 4.0 6.3 5.0 2.2 6.0 4.9 7.0 8.7 8.0 3.5 9.0 9.4 10.0 6.9 v 1 2 3 4 5 6 7 8 9 10 11 u 1 2 3 4 5 6 7 8 9 10 11 0 Figure 2 w t 1.0 3.1 2.0 4.3 3.0 3.6 4.0 5.3 5.0 4.7 6.0 7.0 7.0 6.2 8.0 7.6 9.0 6.9 10.0 8.4 t 1 2 3 4 5 6 7 8 9 10 11 w 1 2 3 4 5 6 7 8 9 10 11 0 Figure 3 m n 1.0 7.2 2.0 9.1 3.0 7.1 4.0 5.4 5.0 7.7 6.0 5.0 7.0 4.3 8.0 6.7 9.0 6.1 10.0 4.4 n 1 2 3 4 5 6 7 8 9 10 11 m 1…part C D 33000331 UPH-1 St. Lawrence dolomite 618 0.05 2.69 2.74 2.83 48000168 Langer Platteville dolomite 127.8 0.06 2.69 2.75 2.86 52000415 3-21-13z1 Galena dolomite 575 0.04 2.72 2.76 2.83 52000415 3-21-13z1 Platteville dolomite 740 0.05 2.7 2.75 2.85 60000086 VD #1 Silurian dolomite 684 0.03 2.75 2.78 2.83 60000086 VD #1 Galena dolomite 1070 0.05 2.69 2.74 2.84 60000086 VD #1 Platteville dolomite 1142 0.02 2.77 2.79 2.83 13001466 NS-2 Tunnel City sandstone 60.1 0.14 2.41 2.54 2.79 13001466 NS-2 Tunnel City sandstone 60.2 0.28 1.93 2.21 2.67 13001466 NS-2 Tunnel City sandstone 118.3 0.3 1.88 2.18 2.7 33000331 UPH-1 St. Peter sandstone 222 0.22 2.06 2.28 2.65 33000331 UPH-1 Jordan sandstone 531 0.21 2.09 2.3 2.65 33000331 UPH-1 Tunnel City sandstone 644 0.18 2.22 2.4 2.7 33000331 UPH-1 Wonewoc sandstone 735 0.2 2.12 2.32 2.65 33000331 UPH-1 Wonewoc sandstone 840 0.27 1.93 2.2 2.66 33000331 UPH-1 Mt. Simon sandstone 927 0.18 2.31 2.49 2.81…
- WAGE EDUC EXPER AGE GENDER RACE 1345 6 2 38 0 1 2435 4 18 52 1 1 1715 6 4 45 1 1 1461 6 4 58 1 1 1639 9 3 30 1 0 1345 5 8 43 0 1 1602 7 6 30 0 1 1144 4 3 33 0 0 1566 6 23 51 1 0 1496 4 15 37 1 1 1234 4 9 45 0 0 1345 6 3 55 0 1 1345 5 14 57 0 1 3389 9 16 36 1 1 1839 4 20 60 1 1 981 4 5 35 1 0 1345 9 10 34 0 1 1566 5 4 28 0 0 1187 6 1 25 0 1 1345 7 10 43 0 1 1345 9 2 42 0 1 2167 4 17 47 1 0 1402 11 2 46 1 1 2115 4 15 52 1 0 2218 8 11 64 1 1 3575 11 1 39 1 1 1972 4 1 39 1 1 1234 4 2 40 0 1 1926 5 9 53 1 0 2165 6 15 59 0 1 2365 6 12 35 0 0 1345 9 5 45 0 1 1839 4 14 37 0 0 2613 5 14 37 1 1 2533 11 3 43 1 1 1602 8 5 32 0 1 1839 9 18 40 0 1 2218 7 1 49 1 1 1529 4 10 43 0 0 1461 1 10 31 1 0 3307 9 22 45 1 1 3833 11 3 31 1 1 1839 4 14 55 1 0 1461 6 5 30 0 1 1433 9 3 28 1 0 2115 6 15 60 0 0 1839 4 13 32 1 0 1288 4 9 58 1 0 1288 6 4 29 0 0Age # of times they shop Max fee 47 4 0 63 2 0 42 3 0 21 2 5 27 4 10 27 4 0 35 2 50 35 30 0 50 3 0 42 24 0 42 4 0 55 6 0 24 4 0 22 4 0 38 2 0 33 2 0 27 10 3 22 1 0 27 2 5 28 1 0 15 3 0 17 2 25 21 0 5 27 2 30 37 4 5 26 4 0 36 6 0 31 4 0 27 30 0 31 5 0 44 4 0 20 3 0 45 5 2 41 4 0 36 2 0 37 3 0 32 4 0 35 1 0 47 2 0 29 1 0 Please outline steps using the JASP or SPSSNumber of ChildrenTable 1 shows the number of women (per 1000) between 15 and 50 years of age who have been married grouped by the number of children they have had. Table 2 gives the same information for women who have never been married.1 Number of Children Women per 1000 0 162 1 213 2 344 3 182 4 69 5+ 32 Table 1 Women who have been married Number of Children Women per 1000 0 752 1 117 2 72 3 35 4 15 5+ 10 Table 2 Women who have never been married 1http://www.census.gov/hhes/fertility/data/cps/2014.html, Table 1, June 2014. Condition gt requires numbers instead of "null" and "0" (a) Without doing any calculations, which of the two samples appears to have the highest mean number of children? Women who have been marriedWomen who have never been married Which of the distributions appears to have the mean most different from the median? Women who have been marriedWomen who have never been married…
- PercentUnder 21 Fatal Accidentsper 1000 13 2.962 12 0.708 8 0.885 12 1.652 11 2.091 17 2.627 18 3.83 8 0.368 13 1.142 8 0.645 9 1.028 16 2.801 12 1.405 9 1.433 10 0.039 9 0.338 11 1.849 12 2.246 14 2.855 14 2.352 11 1.294 17 4.1 8 2.19 16 3.623 15 2.623 9 0.835 8 0.82 14 2.89 8 1.267 15 3.224 10 1.014 10 0.493 14 1.443 18 3.614 10 1.926 14 1.643 16 2.943 12 1.913 15 2.814 13 2.634 9 0.926 17 3.256 D. Give a 95% interval estimate of the number of fatal accidents per 1000 licenses ina city where 15% of the licensed drivers are under 21Interva l Class Mid f cf≤ cf≥ f.m Frequency% fm2 45≤50 47.5 3 3 29 142.5 10.34 6768.75 50≤55 52.5 7 10 26 367.5 24.14 19293.75 55≤60 57.5 4 14 19 230 13.79 13225 60≤65 62.5 5 19 15 312.5 17.24 19531.25 65≤70 67.5 2 21 10 135 6.9 9112.5 70≤75 72.5 5 26 8 362.5 17.24 26281.25 75≤80 77.5 3 29 3 232.5 10.34 18018.75 Total N=29 1782.5 100 112231.3 Use the data in the frequency distribution table above to calculate first quartile, range and inter quartile range.No. Emp. No. Prod. Wkrs. Value Added by Mfg. Cost of Materials Value of Indus. Shipmnts New Cap. Exp. End Yr. Inven. Indus. Grp. 433 370 23518 78713 4 1833 3630 1 131 83 15724 42774 4 1056 3157 1 204 169 24506 27222 4 1405 8732 1 100 70 21667 37040 4 1912 3407 1 220 137 20712 12030 4 1006 1155 1 89 69 12640 13674 3 873 3613 1 26 18 4258 19130 3 487 1946 1 143 72 35210 33521 4 2011 7199 1 171 126 20548 19612 4 1135 3135 1 21 15 23442 5557 3 605 5506 2 3 2 287 163 1 2 42 2 2 2 1508 314 1 15 155 2 6 4 624 2622 1 27 554 2 52 47 2471 4219 2 292 929 3 74 63 4307 5357 2 454 1427 3 13 12 673 1061 1 20 325 3 17 13 817 707 1 84 267 3 169 147 8986 10421 3 534 2083 3 51 41 3145 4140 2 220 697 3 55 44 4076 7125 2 176 1446 3 84 76 3806 8994 2 423 1014 3 61 47 4276 5504 2 464 1291 3 27 22 1239 716 1 22 356 4 200 178 9423 8926 3 200 2314 4 294 250 11045 11121 3 189 2727 4 38 32 1916 2283 1 29 682 4 17 14 599 364 1 21 197 4 34 28 2063 1813 1 20…
- 5 aginAUA wants to know whether recent alumni students from MBA class earn significantly more than recent alumni from BAB class. They take a sample of several students and ask the amount of their monthly salaries in USD (Sheet 32). What can AUA conclude at alpha=0.05? Sheet 32 MBA BAB 515 300 450 420 620 380 630 450 570 420 590 490 750 510 560 470 480 530 250 570 320 480 450 620 625 190 350 280 450 350 570 250 Select one: a. t(stat)=1.92, which is greater than t(cr)=1.7, therefore, we can conclude that MBA graduates earn more BAB graduates. b. t(stat)=1.89, which is greater than t(cr)=1.75, therefore, we can conclude that MBA graduates earn more BAB graduates. c. t(stat)=2.07, which is greater than t(cr)=1.69, therefore, we cannot conclude that MBA graduates earn more BAB graduates. d. t(stat)=2.07, which is greater than t(cr)=1.69, therefore, we can conclude that MBA graduates earn more BAB graduates.x y 1.0 3.6 2.0 4.1 3.0 3.6 4.0 5.3 5.0 4.4 6.0 6.8 7.0 5.7 8.0 7.8 9.0 6.7 10.0 7.8 y 1 2 3 4 5 6 7 8 9 10 11 x 1 2 3 4 5 6 7 8 9 10 11 0 Figure 1 u v 1.0 7.8 2.0 8.7 3.0 6.8 4.0 5.6 5.0 8.3 6.0 5.2 7.0 4.2 8.0 7.0 9.0 6.1 10.0 3.5 v 1 2 3 4 5 6 7 8 9 10 11 u 1 2 3 4 5 6 7 8 9 10 11 0 Figure 2 w t 1.0 6.9 2.0 9.5 3.0 3.8 4.0 9.0 5.0 5.0 6.0 2.3 7.0 5.9 8.0 10.2 9.0 4.8 10.0 7.6 t 1 2 3 4 5 6 7 8 9 10 11 w 1 2 3 4 5 6 7 8 9 10 11 0 Figure 3 m n 1.0 7.8 2.0 7.1 3.0 8.0 4.0 5.9 5.0 7.4 6.0 4.5 7.0 5.2 8.0 3.7 9.0 4.1 10.0 3.5 n 1 2 3 4 5 6 7 8 9 10 11 m 1 2…