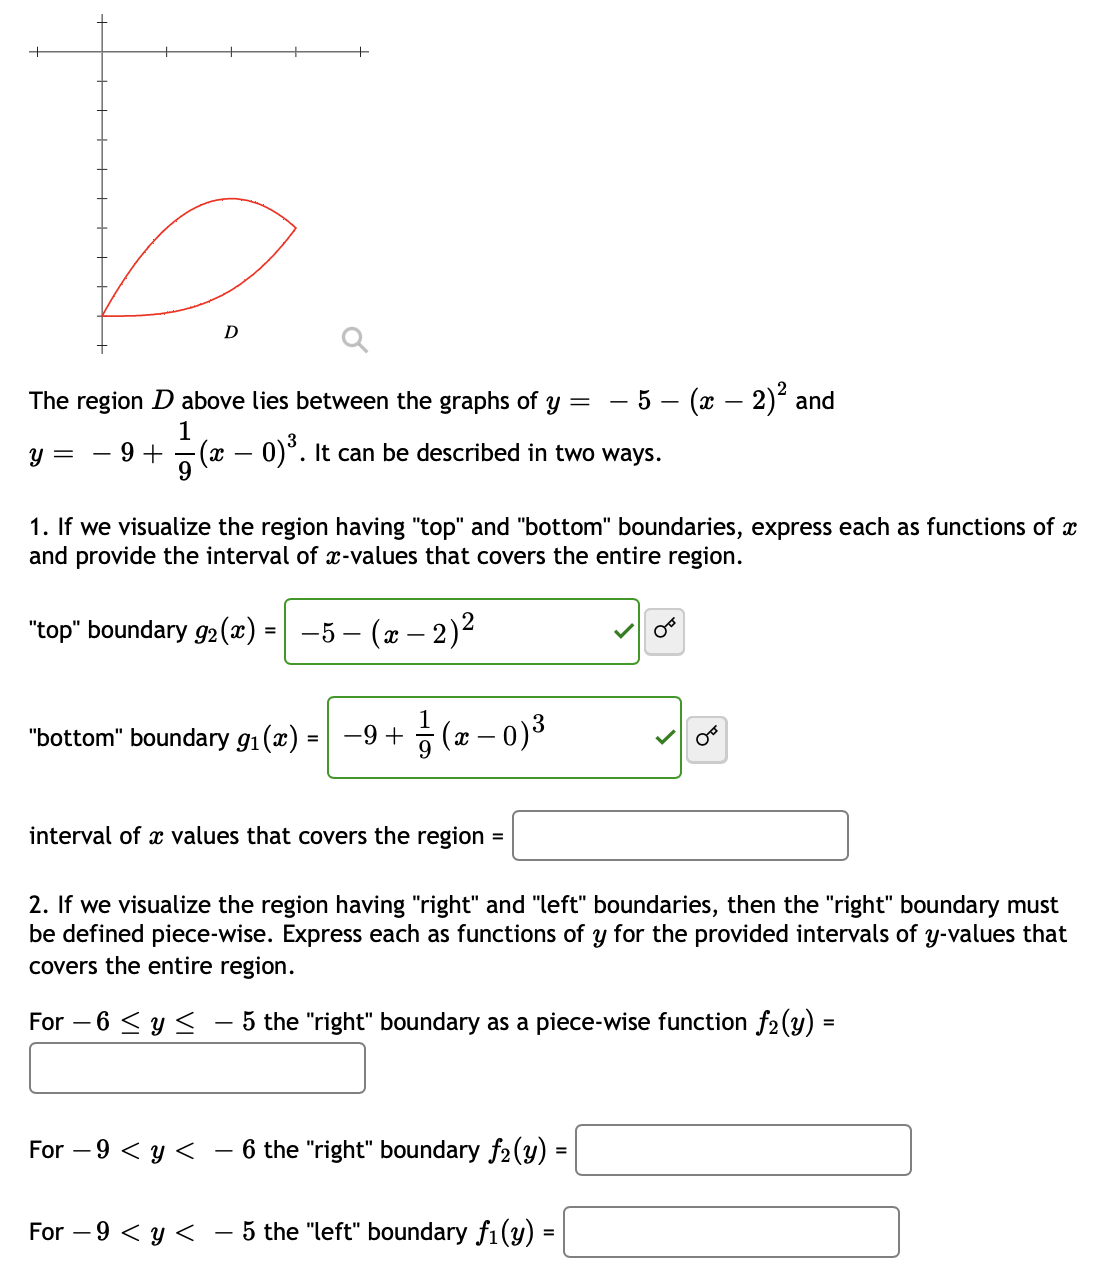
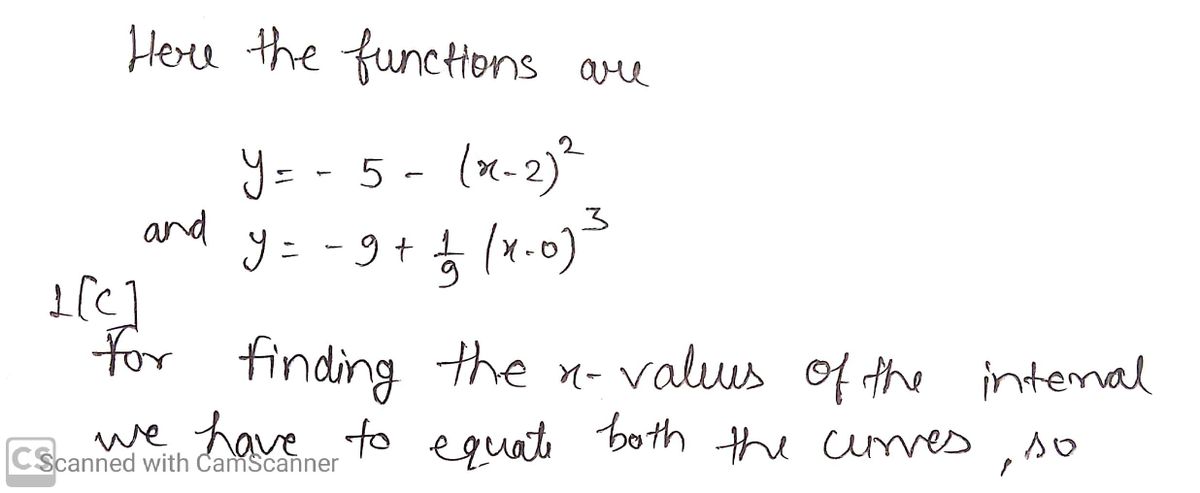
The region D above lies between the graphs of y = - 5 – (x – 2) and 1 9 + -(x – 0)°. It can be described in two ways. 9 y = 1. If we visualize the region having "top" and "bottom" boundaries, express each as functions of x and provide the interval of x-values that covers the entire region. "top" boundary g2 (x) = | -5 – (x – 2)² of "bottom" boundary g1(x) = | -9+ (x – 0)3 interval of values that covers the region = 2. If we visualize the region having "right" and "left" boundaries, then the "right" boundary must be defined piece-wise. Express each as functions of y for the provided intervals of y-values that covers the entire region. For – 6 < y < - 5 the "right" boundary as a piece-wise function f2(y) = For – 9 < y < – 6 the "right" boundary f2(y) = %3D For – 9 < y < 5 the "left" boundary f1(y) =
The region D above lies between the graphs of y = - 5 – (x – 2) and 1 9 + -(x – 0)°. It can be described in two ways. 9 y = 1. If we visualize the region having "top" and "bottom" boundaries, express each as functions of x and provide the interval of x-values that covers the entire region. "top" boundary g2 (x) = | -5 – (x – 2)² of "bottom" boundary g1(x) = | -9+ (x – 0)3 interval of values that covers the region = 2. If we visualize the region having "right" and "left" boundaries, then the "right" boundary must be defined piece-wise. Express each as functions of y for the provided intervals of y-values that covers the entire region. For – 6 < y < - 5 the "right" boundary as a piece-wise function f2(y) = For – 9 < y < – 6 the "right" boundary f2(y) = %3D For – 9 < y < 5 the "left" boundary f1(y) =

Intermediate Algebra
10th Edition
ISBN:9781285195728
Author:Jerome E. Kaufmann, Karen L. Schwitters
Publisher:Jerome E. Kaufmann, Karen L. Schwitters
Chapter7: Equations And Inequalities In Two Variables
Section7.1: Rectangular Coordinate System And Linear Equations
Problem 59PS: Now lets use a graphing calculator to get a graph of C=59(F32). By letting F=x and C=y, we obtain...

Related questions
Question
Transcribed Image Text:The region D above lies between the graphs of y =
– 5 – (x – 2)² and
1
9 + -(x – 0)°. It can be described in two ways.
3
y =
1. If we visualize the region having "top" and "bottom" boundaries, express each as functions of x
and provide the interval of x-values that covers the entire region.
"top" boundary g2(x) = | -5 – (x – 2)²
"bottom" boundary g1(x)
(x – 0)3
-9 +
interval of x values that covers the region
=
2. If we visualize the region having "right" and "left" boundaries, then the "right" boundary must
be defined piece-wise. Express each as functions of y for the provided intervals of y-values that
covers the entire region.
For – 6 < y <
5 the "right" boundary as a piece-wise function f2(y) =
For – 9 < y <
- 6 the "right" boundary f2(y)
For – 9 < y <
- 5 the "left" boundary f1(y) =
Expert Solution
Step 1

Trending now
This is a popular solution!

Step by step
Solved in 3 steps with 3 images

Recommended textbooks for you
Intermediate Algebra
Algebra
ISBN:
9781285195728
Author:
Jerome E. Kaufmann, Karen L. Schwitters
Publisher:
Cengage Learning

College Algebra
Algebra
ISBN:
9781305115545
Author:
James Stewart, Lothar Redlin, Saleem Watson
Publisher:
Cengage Learning

Algebra & Trigonometry with Analytic Geometry
Algebra
ISBN:
9781133382119
Author:
Swokowski
Publisher:
Cengage
Intermediate Algebra
Algebra
ISBN:
9781285195728
Author:
Jerome E. Kaufmann, Karen L. Schwitters
Publisher:
Cengage Learning
College Algebra
Algebra
ISBN:
9781305115545
Author:
James Stewart, Lothar Redlin, Saleem Watson
Publisher:
Cengage Learning
Algebra & Trigonometry with Analytic Geometry
Algebra
ISBN:
9781133382119
Author:
Swokowski
Publisher:
Cengage