The relative growth rate r of a function f measures the change in the function compared to its value at a particular point. It is computed as r(1) = 7 A logistic growth model for a certain population with a base population of 5 individuals, carrying capacity individuals, and a base growth rate of 0.025 is shown below. Complete parts (a) through (c). 60 P(t) = 5+7e -0.025 P'(0) a. Is the relative growth in 1999 (t= 0) for the logistic model of the above population equal to r(0) = DVO = 0.015 (rounding to three decimal places)? This would mean that the population was growing at 1.5% per year. Yes O No b. Compute the relative growth rate of the population in 2005 and 2030. What appears to be happening to the relative growth rates as time increases? r(6) =O r(31) = (Round to four decimal places as needed.) What appears to be happening to the relative growth rates as time increases? O A. As time increases, the rate population growth decreases. O B. As time increases, the rate population growth increases. O C. As time increases, the rate of population growth nears the carrying capacity.
The relative growth rate r of a function f measures the change in the function compared to its value at a particular point. It is computed as r(1) = 7 A logistic growth model for a certain population with a base population of 5 individuals, carrying capacity individuals, and a base growth rate of 0.025 is shown below. Complete parts (a) through (c). 60 P(t) = 5+7e -0.025 P'(0) a. Is the relative growth in 1999 (t= 0) for the logistic model of the above population equal to r(0) = DVO = 0.015 (rounding to three decimal places)? This would mean that the population was growing at 1.5% per year. Yes O No b. Compute the relative growth rate of the population in 2005 and 2030. What appears to be happening to the relative growth rates as time increases? r(6) =O r(31) = (Round to four decimal places as needed.) What appears to be happening to the relative growth rates as time increases? O A. As time increases, the rate population growth decreases. O B. As time increases, the rate population growth increases. O C. As time increases, the rate of population growth nears the carrying capacity.

Chapter6: Exponential And Logarithmic Functions
Section6.1: Exponential Functions
Problem 60SE: The formula for the amount A in an investmentaccount with a nominal interest rate r at any timet is...

Related questions

Question
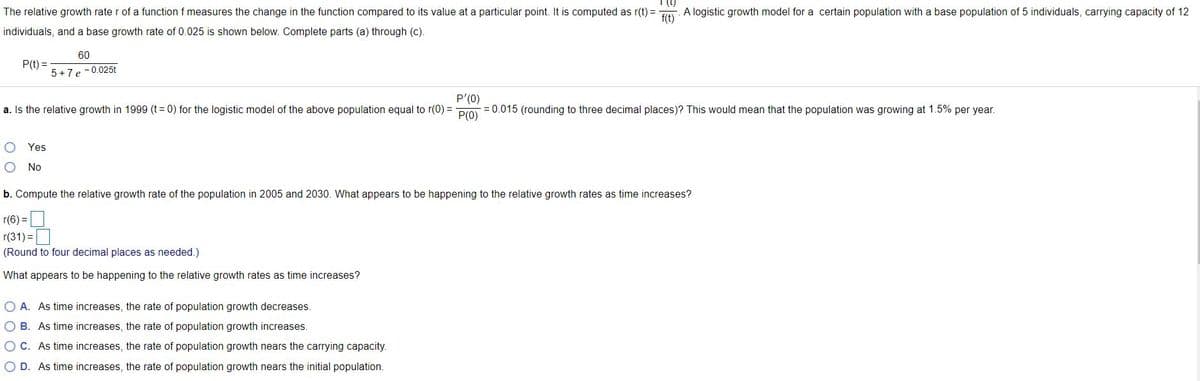
Transcribed Image Text:The relative growth rate r of a function f measures the change in the function compared to its value at a particular point. It is computed as r(t) = TAT A logistic growth model for a certain population with a base population of 5 individuals, carrying capacity of 12
individuals, and a base growth rate of 0.025 is shown below. Complete parts (a) through (c).
60
P(t) =
5 +7e -0.025t
P'(0)
a. Is the relative growth in 1999 (t= 0) for the logistic model of the above population equal to r(0) =
= 0.015 (rounding to three decimal places)? This would mean that the population was growing at 1.5% per year.
P(0)
Yes
No
b. Compute the relative growth rate of the population in 2005 and 2030. What appears to be happening to the relative growth rates as time increases?
r(6) =
r(31) =|
(Round to four decimal places as needed.)
What appears to be happening to the relative growth rates as time increases?
O A. As time increases, the rate of population growth decreases.
O B. As time increases, the rate of population growth increases.
OC. As time increases, the rate of population growth nears the carrying capacity.
O D. As time increases, the rate of population growth nears the initial population.
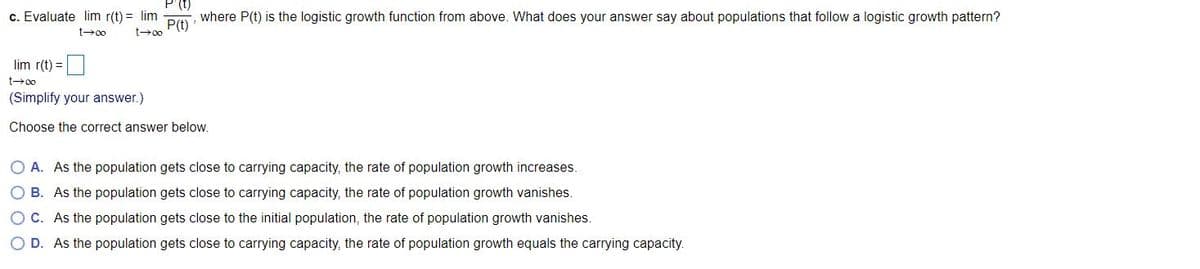
Transcribed Image Text:P'(t)
c. Evaluate lim r(t) = lim
P(t)
where P(t) is the logistic growth function from above. What does your answer say about populations that follow a logistic growth pattern?
t00
t00
lim r(t) =
t00
(Simplify your answer.)
Choose the correct answer below.
O A. As the population gets close to carrying capacity, the rate of population growth increases.
O B. As the population gets close to carrying capacity, the rate of population growth vanishes.
O C. As the population gets close to the initial population, the rate of population growth vanishes.
O D. As the population gets close to carrying capacity, the rate of population growth equals the carrying capacity.
Expert Solution
This question has been solved!
Explore an expertly crafted, step-by-step solution for a thorough understanding of key concepts.

This is a popular solution!

Trending now
This is a popular solution!

Step by step
Solved in 3 steps with 2 images

Knowledge Booster


Learn more about
Need a deep-dive on the concept behind this application? Look no further. Learn more about this topic, calculus and related others by exploring similar questions and additional content below.Recommended textbooks for you

Functions and Change: A Modeling Approach to Coll…
Algebra
ISBN:
9781337111348
Author:
Bruce Crauder, Benny Evans, Alan Noell
Publisher:
Cengage Learning

Algebra & Trigonometry with Analytic Geometry
Algebra
ISBN:
9781133382119
Author:
Swokowski
Publisher:
Cengage
Functions and Change: A Modeling Approach to Coll…
Algebra
ISBN:
9781337111348
Author:
Bruce Crauder, Benny Evans, Alan Noell
Publisher:
Cengage Learning
Algebra & Trigonometry with Analytic Geometry
Algebra
ISBN:
9781133382119
Author:
Swokowski
Publisher:
Cengage