The revenue R (in millions of dollars) for a company from 1999 to 2005 can be modeled by the equation below, where t is the year, with t = 9 corresponding to 1999. R = 0.59221t4 – 18.0042t3 + 175.293r2 - 316.42t – 116.5 Polo Ralph Lauren Revenue 4000 3500 3000 2500 2000 1500 10 11 12 13 14 15 Year (9+ 1999) (a) Find the slope of the graph for the year 2002. (Round your answer to two decimal places.) Find the slope of the graph for the year 2004. (Round your answer to two decimal places.) (b) What are the units for the slope of the graph? O dollars per year millions of dollars millions of dollars per year dollars O no units Interpret the slope of the graph in the context of the problem. The slope of the graph at time t is the rate at which sales are increasing. The slope of the graph at time t is the rate at which average sales are increasing. The slope of the graph at time t is the total amount of sales. The slope of the graph at time t is the effect time has had on sales. The slope of the graph at time t is the amount by which sales are increasing. anuanay (in millions of dollars)

Algebra & Trigonometry with Analytic Geometry
13th Edition
ISBN:9781133382119
Author:Swokowski
Publisher:Swokowski
Chapter4: Polynomial And Rational Functions
Section4.3: Zeros Of Polynomials
Problem 67E
icon
Related questions
icon
Concept explainers
Question
The revenue R (in millions of dollars) for a company from 1999 to 2005 can be modeled by the equation below, where t is the year, witht = 9 corresponding to 1999.
R = 0.59221t4 – 18.0042t3 + 175.293t2 - 316.42t – 116.5
Polo Ralph Lauren Revenue
R
4000
3500
3000
2500
2000
1500
9 10 1I 12 13 14 15
Year (9 + 1999)
(a) Find the slope of the graph for the year 2002. (Round your answer to two decimal places.)
Find the slope of the graph for the year 2004. (Round your answer to two decimal places.)
(b) What are the units for the slope of the graph?
O dollars per year
millions of dollars
millions of dollars per year
dollars
no units
Interpret the slope of the graph in the context of the problem.
The slope of the graph at time t is the rate at which sales are increasing.
The slope of the graph at time t is the rate at which average sales are increasing.
The slope of the graph at time t is the total amount of sales.
The slope of the graph at time t is the effect time has had on sales.
O The slope of the graph at time t is the amount by which sales are increasing.
Revenue
(in millions of dollars)
Transcribed Image Text:The revenue R (in millions of dollars) for a company from 1999 to 2005 can be modeled by the equation below, where t is the year, witht = 9 corresponding to 1999. R = 0.59221t4 – 18.0042t3 + 175.293t2 - 316.42t – 116.5 Polo Ralph Lauren Revenue R 4000 3500 3000 2500 2000 1500 9 10 1I 12 13 14 15 Year (9 + 1999) (a) Find the slope of the graph for the year 2002. (Round your answer to two decimal places.) Find the slope of the graph for the year 2004. (Round your answer to two decimal places.) (b) What are the units for the slope of the graph? O dollars per year millions of dollars millions of dollars per year dollars no units Interpret the slope of the graph in the context of the problem. The slope of the graph at time t is the rate at which sales are increasing. The slope of the graph at time t is the rate at which average sales are increasing. The slope of the graph at time t is the total amount of sales. The slope of the graph at time t is the effect time has had on sales. O The slope of the graph at time t is the amount by which sales are increasing. Revenue (in millions of dollars)
Expert Solution
Step 1

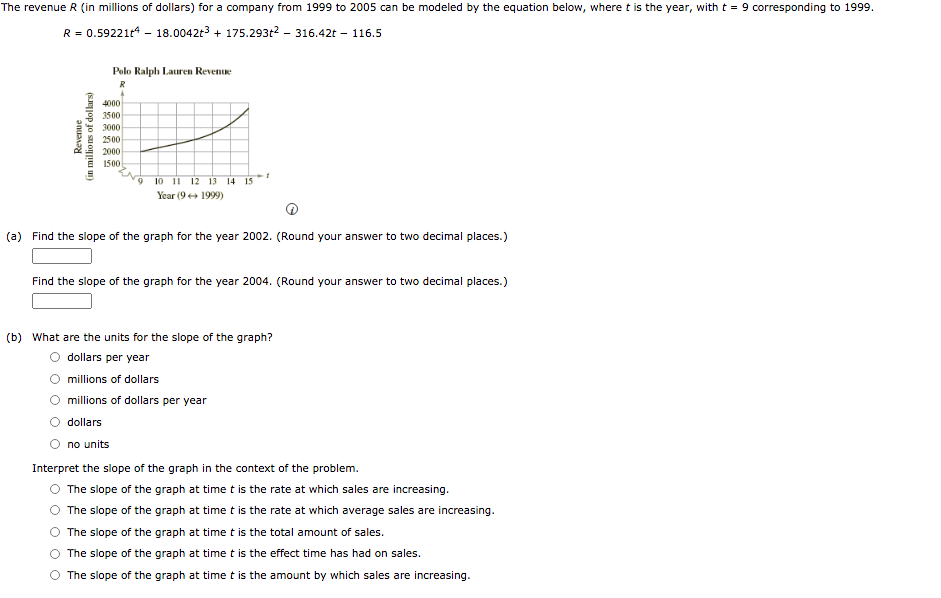
For the given Revenue function slope is calculated as shown below 


trending now

Trending now

This is a popular solution!

steps

Step by step

Solved in 3 steps with 2 images

Blurred answer
Knowledge Booster
Continuous Probability Distribution
Learn more about
Need a deep-dive on the concept behind this application? Look no further. Learn more about this topic, calculus and related others by exploring similar questions and additional content below.
Recommended textbooks for you
Algebra & Trigonometry with Analytic Geometry
Algebra
ISBN:
9781133382119
Author:
Swokowski
Publisher:
Cengage
Trigonometry (MindTap Course List)
Trigonometry
ISBN:
9781337278461
Author:
Ron Larson
Publisher:
Cengage Learning
College Algebra
College Algebra
Algebra
ISBN:
9781337282291
Author:
Ron Larson
Publisher:
Cengage Learning
College Algebra
College Algebra
Algebra
ISBN:
9781938168383
Author:
Jay Abramson
Publisher:
OpenStax