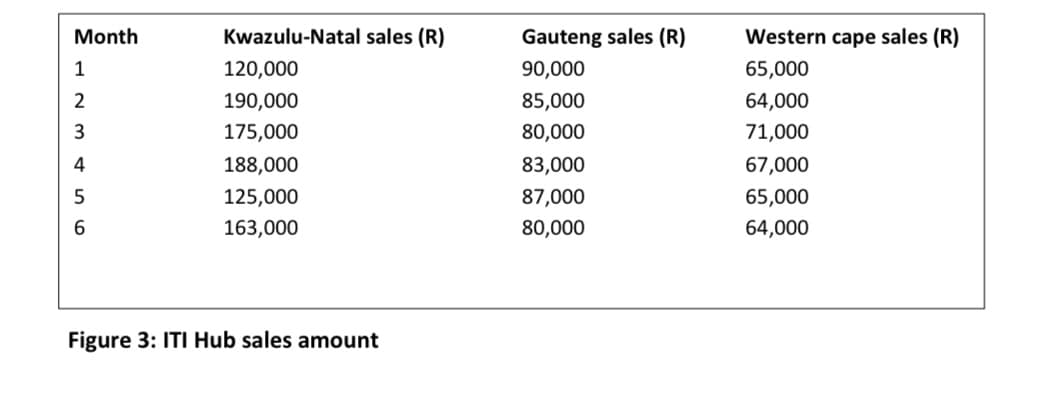
The sales manager at ITI Hub has asked you to design and implement a Windows application that will display the total sales made in there three regions in South Africa: Kwazulu-Natal, Gauteng and Western cape. The application should display the total sales of the company as well as the percentage that each region contributed to the total sales. Display the sales amounts with a Rand sign and no decimal places. Display the percentages with a percent symbol with no decimal places. The sales amounts for six months are shown in Figure 3. Create a windows application form for this project using the name ITI Hub regional sales. Store the sales amount in a two-dimensional array. Create a suitable interface with an image for the project and run the application


The sales manager at ITI Hub has asked you to design and implement a Windows application that will display the total sales made in there three regions in South Africa: Kwazulu-Natal, Gauteng and Western cape. The application should display the total sales of the company as well as the percentage that each region contributed to the total sales. Display the sales amounts with a Rand sign and no decimal places. Display the percentages with a percent symbol with no decimal places. The sales amounts for six months are shown in Figure 3. Create a windows application form for this project using the name ITI Hub regional sales. Store the sales amount in a two-dimensional array. Create a suitable interface with an image for the project and run the application


Trending now
This is a popular solution!

Step by step
Solved in 4 steps with 3 images


