The sales of XYZ company (in million pesos) for each year are shown in the table below. Year 2005 2006 2007 2008 2009 Sales 12 19 29 37 45 a) Find the linear equation that best fits the data. b) Use the linear equation as a model to estimate the sales of the XYZ company in 2012.
The sales of XYZ company (in million pesos) for each year are shown in the table below. Year 2005 2006 2007 2008 2009 Sales 12 19 29 37 45 a) Find the linear equation that best fits the data. b) Use the linear equation as a model to estimate the sales of the XYZ company in 2012.

Algebra & Trigonometry with Analytic Geometry
13th Edition
ISBN:9781133382119
Author:Swokowski
Publisher:Swokowski
Chapter3: Functions And Graphs
Section3.3: Lines
Problem 23E

Related questions
Question
4
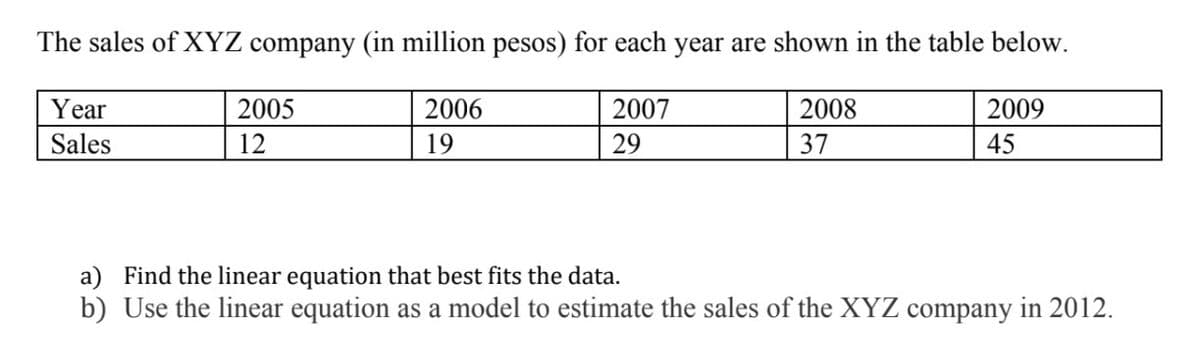
Transcribed Image Text:The sales of XYZ company (in million pesos) for each year are shown in the table below.
Year
2005
2006
2007
2008
2009
Sales
12
19
29
37
45
a) Find the linear equation that best fits the data.
b) Use the linear equation as a model to estimate the sales of the XYZ company in 2012.
Expert Solution
This question has been solved!
Explore an expertly crafted, step-by-step solution for a thorough understanding of key concepts.

Step by step
Solved in 3 steps with 5 images

Recommended textbooks for you
Algebra & Trigonometry with Analytic Geometry
Algebra
ISBN:
9781133382119
Author:
Swokowski
Publisher:
Cengage
Algebra & Trigonometry with Analytic Geometry
Algebra
ISBN:
9781133382119
Author:
Swokowski
Publisher:
Cengage