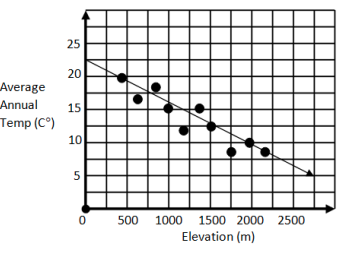
The scatter plot above depicts the relationship between a elevation measured in Meters (m) and average annual temperature measured in Celsius (Co). The line of best fit is shown. The equation of the line of best fit is C = 22.5 - (1/160)m a. What is the slope of the line of best fit? b. Write a one-sentence interpretation of the slope in the context of this elevation and average annual temperature example. Refer to the specific number and units involved.
The scatter plot above depicts the relationship between a elevation measured in Meters (m) and average annual temperature measured in Celsius (Co). The line of best fit is shown. The equation of the line of best fit is C = 22.5 - (1/160)m a. What is the slope of the line of best fit? b. Write a one-sentence interpretation of the slope in the context of this elevation and average annual temperature example. Refer to the specific number and units involved.
Algebra & Trigonometry with Analytic Geometry
13th Edition
ISBN:9781133382119
Author:Swokowski
Publisher:Swokowski
Chapter8: Applications Of Trigonometry
Section: Chapter Questions
Problem 7RE
Related questions
Question
The
The equation of the line of best fit is C = 22.5 - (1/160)m
a. What is the slope of the line of best fit?
b. Write a one-sentence interpretation of the slope in the context of this elevation and average annual temperature example. Refer to the specific number and units involved.

Transcribed Image Text:25
20
Average
Annual
Temp (C°)
15
10
5
500 1000 1500 2000 2500
Elevation (m)
Expert Solution
This question has been solved!
Explore an expertly crafted, step-by-step solution for a thorough understanding of key concepts.
This is a popular solution!
Trending now
This is a popular solution!
Step by step
Solved in 3 steps with 1 images

Recommended textbooks for you

Algebra & Trigonometry with Analytic Geometry
Algebra
ISBN:
9781133382119
Author:
Swokowski
Publisher:
Cengage

Trigonometry (MindTap Course List)
Trigonometry
ISBN:
9781337278461
Author:
Ron Larson
Publisher:
Cengage Learning

Algebra & Trigonometry with Analytic Geometry
Algebra
ISBN:
9781133382119
Author:
Swokowski
Publisher:
Cengage

Trigonometry (MindTap Course List)
Trigonometry
ISBN:
9781337278461
Author:
Ron Larson
Publisher:
Cengage Learning