The scatter plot and linear regression models for the yearly revenue of restaurants (R) and supermarkets (S) are given in the popup below. The revenue for restaurants can be modeled by the equation R= 13.5n + 170.5, and for supermarkets can be modeled by the equation S= 5.5n+ 225.5, where n is the number of years since 1986 and revenue is in billions of dollars. a. Interpret the slope of each model. b. Use the model to predict the revenue of restaurants and the revenue of supermarkets in 2017. c. Estimate the first year that restaurant revenue will exceed supermarket revenue by at least 150 billion dollars. Click the icon to view the scatter plot and data table of yearly revenue. a. Interpret the slope of each model. The slope of the linear regression model for restaurants shows that the revenue is at a rate of billion dollars per year. (Type an integer or a decimal.)
The scatter plot and linear regression models for the yearly revenue of restaurants (R) and supermarkets (S) are given in the popup below. The revenue for restaurants can be modeled by the equation R= 13.5n + 170.5, and for supermarkets can be modeled by the equation S= 5.5n+ 225.5, where n is the number of years since 1986 and revenue is in billions of dollars. a. Interpret the slope of each model. b. Use the model to predict the revenue of restaurants and the revenue of supermarkets in 2017. c. Estimate the first year that restaurant revenue will exceed supermarket revenue by at least 150 billion dollars. Click the icon to view the scatter plot and data table of yearly revenue. a. Interpret the slope of each model. The slope of the linear regression model for restaurants shows that the revenue is at a rate of billion dollars per year. (Type an integer or a decimal.)

College Algebra
7th Edition
ISBN:9781305115545
Author:James Stewart, Lothar Redlin, Saleem Watson
Publisher:James Stewart, Lothar Redlin, Saleem Watson
Chapter1: Equations And Graphs
Section1.3: Lines
Problem 92E

Related questions
Question
Question is attached to the screenshot below. Thanks.
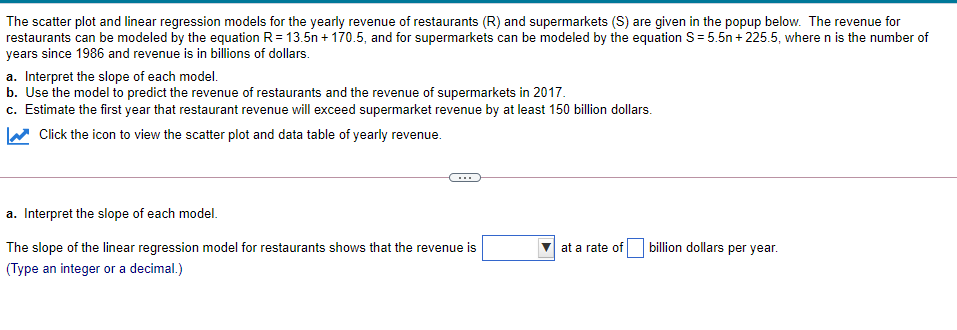
Transcribed Image Text:The scatter plot and linear regression models for the yearly revenue of restaurants (R) and supermarkets (S) are given in the popup below. The revenue for
restaurants can be modeled by the equation R= 13.5n + 170.5, and for supermarkets can be modeled by the equation S= 5.5n + 225.5, wheren is the number of
years since 1986 and revenue is in billions of dollars.
a. Interpret the slope of each model.
b. Use the model to predict the revenue of restaurants and the revenue of supermarkets in 2017.
c. Estimate the first year that restaurant revenue will exceed supermarket revenue by at least 150 billion dollars.
Click the icon to view the scatter plot and data table of yearly revenue.
...
a. Interpret the slope of each model.
The slope of the linear regression model for restaurants shows that the revenue is
at a rate of
billion dollars per year.
(Type an integer or a decimal.)
Expert Solution
This question has been solved!
Explore an expertly crafted, step-by-step solution for a thorough understanding of key concepts.

This is a popular solution!

Trending now
This is a popular solution!

Step by step
Solved in 2 steps

Recommended textbooks for you
College Algebra
Algebra
ISBN:
9781305115545
Author:
James Stewart, Lothar Redlin, Saleem Watson
Publisher:
Cengage Learning

Algebra and Trigonometry (MindTap Course List)
Algebra
ISBN:
9781305071742
Author:
James Stewart, Lothar Redlin, Saleem Watson
Publisher:
Cengage Learning

College Algebra
Algebra
ISBN:
9781305115545
Author:
James Stewart, Lothar Redlin, Saleem Watson
Publisher:
Cengage Learning
Algebra and Trigonometry (MindTap Course List)
Algebra
ISBN:
9781305071742
Author:
James Stewart, Lothar Redlin, Saleem Watson
Publisher:
Cengage Learning

Glencoe Algebra 1, Student Edition, 9780079039897…
Algebra
ISBN:
9780079039897
Author:
Carter
Publisher:
McGraw Hill

Elementary Algebra
Algebra
ISBN:
9780998625713
Author:
Lynn Marecek, MaryAnne Anthony-Smith
Publisher:
OpenStax - Rice University

Linear Algebra: A Modern Introduction
Algebra
ISBN:
9781285463247
Author:
David Poole
Publisher:
Cengage Learning