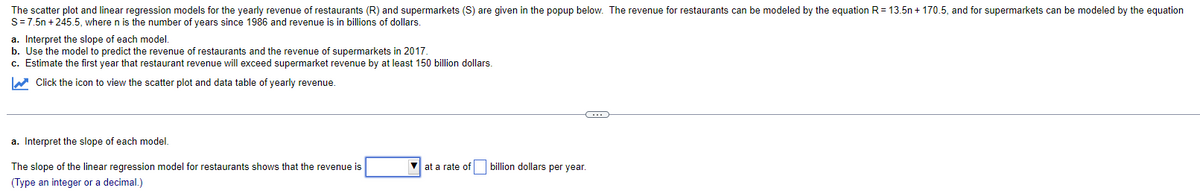
The scatter plot and linear regression models for the yearly revenue of restaurants (R) and supermarkets (S) are given in the popup below. The revenue for restaurants can be modeled by the equation R= 13.5n+ 170.5, and for supermarkets can be modeled by the equation S=7.5n+245.5, where n is the number of years since 1986 and revenue is in billions of dollars. a. Interpret the slope of each model. b. Use the model to predict the revenue of restaurants and the revenue of supermarkets in 2017. c. Estimate the first year that restaurant revenue will exceed supermarket revenue by at least 150 billion dollars. Click the icon to view the scatter plot and data table of yearly revenue. a. Interpret the slope of each model. The slope of the linear regression model t restaurants shows that the revenue is (Type an integer or a decimal.) at a rate of billion dollars per year.
The scatter plot and linear regression models for the yearly revenue of restaurants (R) and supermarkets (S) are given in the popup below. The revenue for restaurants can be modeled by the equation R= 13.5n+ 170.5, and for supermarkets can be modeled by the equation S=7.5n+245.5, where n is the number of years since 1986 and revenue is in billions of dollars. a. Interpret the slope of each model. b. Use the model to predict the revenue of restaurants and the revenue of supermarkets in 2017. c. Estimate the first year that restaurant revenue will exceed supermarket revenue by at least 150 billion dollars. Click the icon to view the scatter plot and data table of yearly revenue. a. Interpret the slope of each model. The slope of the linear regression model t restaurants shows that the revenue is (Type an integer or a decimal.) at a rate of billion dollars per year.

Big Ideas Math A Bridge To Success Algebra 1: Student Edition 2015
1st Edition
ISBN:9781680331141
Author:HOUGHTON MIFFLIN HARCOURT
Publisher:HOUGHTON MIFFLIN HARCOURT
Chapter6: Exponential Functions And Sequences
Section: Chapter Questions
Problem 6CA

Related questions
Question
Transcribed Image Text:The scatter plot and linear regression models for the yearly revenue of restaurants (R) and supermarkets (S) are given in the popup below. The revenue for restaurants can be modeled by the equation R = 13.5n+ 170.5, and for supermarkets can be modeled by the equation
S = 7.5n+245.5, where n is the number of years since 1986 and revenue is in billions of dollars.
a. Interpret the slope of each model.
b. Use the model to predict the revenue of restaurants and the revenue of supermarkets in 2017.
c. Estimate the first year that restaurant revenue will exceed supermarket revenue by at least 150 billion dollars.
Click the icon to view the scatter plot and data table of yearly revenue.
a. Interpret the slope of each model.
The slope of the linear regression model for restaurants shows that the revenue is
(Type an integer or a decimal.)
▼at a rate of
C
billion dollars per year.
Expert Solution
This question has been solved!
Explore an expertly crafted, step-by-step solution for a thorough understanding of key concepts.

This is a popular solution!

Trending now
This is a popular solution!

Step by step
Solved in 2 steps with 2 images

Recommended textbooks for you
Big Ideas Math A Bridge To Success Algebra 1: Stu…
Algebra
ISBN:
9781680331141
Author:
HOUGHTON MIFFLIN HARCOURT
Publisher:
Houghton Mifflin Harcourt

Trigonometry (MindTap Course List)
Trigonometry
ISBN:
9781337278461
Author:
Ron Larson
Publisher:
Cengage Learning

College Algebra
Algebra
ISBN:
9781305115545
Author:
James Stewart, Lothar Redlin, Saleem Watson
Publisher:
Cengage Learning
Big Ideas Math A Bridge To Success Algebra 1: Stu…
Algebra
ISBN:
9781680331141
Author:
HOUGHTON MIFFLIN HARCOURT
Publisher:
Houghton Mifflin Harcourt
Trigonometry (MindTap Course List)
Trigonometry
ISBN:
9781337278461
Author:
Ron Larson
Publisher:
Cengage Learning
College Algebra
Algebra
ISBN:
9781305115545
Author:
James Stewart, Lothar Redlin, Saleem Watson
Publisher:
Cengage Learning

Algebra and Trigonometry (MindTap Course List)
Algebra
ISBN:
9781305071742
Author:
James Stewart, Lothar Redlin, Saleem Watson
Publisher:
Cengage Learning

Intermediate Algebra
Algebra
ISBN:
9781285195728
Author:
Jerome E. Kaufmann, Karen L. Schwitters
Publisher:
Cengage Learning
