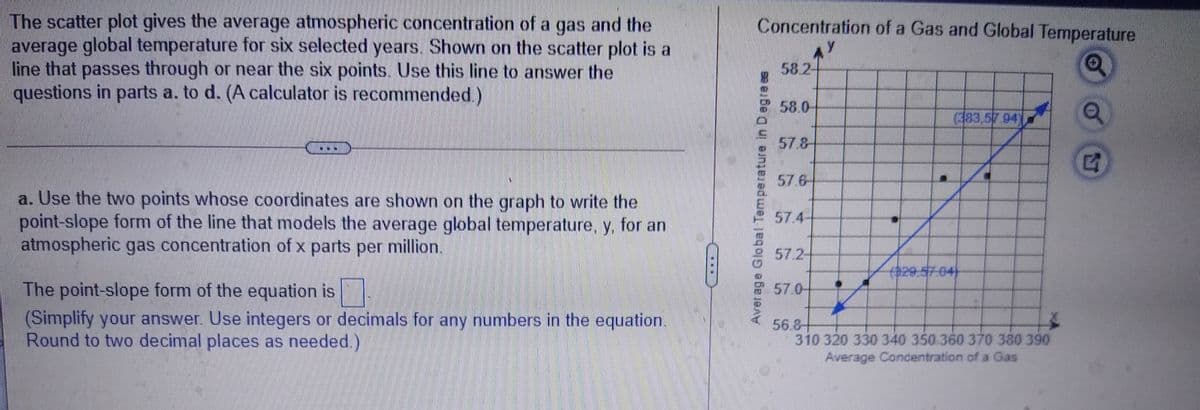
The scatter plot gives the average atmospheric concentration of a gas and the average global temperature for six selected years. Shown on the scatter plot is a line that passes through or near the six points. Use this line to answer the questions in parts a. to d. (A calculator is recommended.) Concentration of a Gas and Global Temperature 58.2- 8 58.0- (383,57 94 57.8 57.6 a. Use the two points whose coordinates are shown on the graph to write the point-slope form of the line that models the average global temperature, y, for an atmospheric gas concentration of x parts per million. 57.4- 57.2- 929 04 The point-slope form of the equation is (Simplify your answer. Use integers or decimals for any numbers in the equation. Round to two decimal places as needed.) 57.0- 56.8- 310 320 330 340 350 360 370 380 390 ncentration of a Gas Aver age Global Temperature in D egre es
The scatter plot gives the average atmospheric concentration of a gas and the average global temperature for six selected years. Shown on the scatter plot is a line that passes through or near the six points. Use this line to answer the questions in parts a. to d. (A calculator is recommended.) Concentration of a Gas and Global Temperature 58.2- 8 58.0- (383,57 94 57.8 57.6 a. Use the two points whose coordinates are shown on the graph to write the point-slope form of the line that models the average global temperature, y, for an atmospheric gas concentration of x parts per million. 57.4- 57.2- 929 04 The point-slope form of the equation is (Simplify your answer. Use integers or decimals for any numbers in the equation. Round to two decimal places as needed.) 57.0- 56.8- 310 320 330 340 350 360 370 380 390 ncentration of a Gas Aver age Global Temperature in D egre es

Chapter3: Polynomial Functions
Section3.5: Mathematical Modeling And Variation
Problem 71E

Related questions
Question
The first answer is wrong please can you resolve it?
Transcribed Image Text:The scatter plot gives the average atmospheric concentration of a gas and the
average global temperature for six selected years. Shown on the scatter plot is a
line that passes through or near the six points. Use this line to answer the
questions in parts a. to d. (A calculator is recommended.)
Concentration of a Gas and Global Temperature
58.2-
58.0-
(383,57 94)
57.8-
57.6-
a. Use the two points whose coordinates are shown on the graph to write the
point-slope form of the line that models the average global temperature, y, for an
atmospheric gas concentration of x parts per million.
57.4-
57.2-
429-57-04)
The point-slope form of the equation is
(Simplify your answer. Use integers or decimals for any numbers in the equation,
Round to two decimal places as needed.)
57.0-
56.8+
310 320 330 340 350 360 370 380 390
Average Concentration of a Gas
Aver age Global Temperature in Degre es
Expert Solution
This question has been solved!
Explore an expertly crafted, step-by-step solution for a thorough understanding of key concepts.

This is a popular solution!

Trending now
This is a popular solution!

Step by step
Solved in 2 steps

Recommended textbooks for you

Big Ideas Math A Bridge To Success Algebra 1: Stu…
Algebra
ISBN:
9781680331141
Author:
HOUGHTON MIFFLIN HARCOURT
Publisher:
Houghton Mifflin Harcourt

Glencoe Algebra 1, Student Edition, 9780079039897…
Algebra
ISBN:
9780079039897
Author:
Carter
Publisher:
McGraw Hill
Big Ideas Math A Bridge To Success Algebra 1: Stu…
Algebra
ISBN:
9781680331141
Author:
HOUGHTON MIFFLIN HARCOURT
Publisher:
Houghton Mifflin Harcourt
Glencoe Algebra 1, Student Edition, 9780079039897…
Algebra
ISBN:
9780079039897
Author:
Carter
Publisher:
McGraw Hill

Holt Mcdougal Larson Pre-algebra: Student Edition…
Algebra
ISBN:
9780547587776
Author:
HOLT MCDOUGAL
Publisher:
HOLT MCDOUGAL

Trigonometry (MindTap Course List)
Trigonometry
ISBN:
9781337278461
Author:
Ron Larson
Publisher:
Cengage Learning

Algebra & Trigonometry with Analytic Geometry
Algebra
ISBN:
9781133382119
Author:
Swokowski
Publisher:
Cengage