The scatter plot shows the number of hours worked and money spent on entertainment by each of 25 students. Also shown is the line of best fit for the data. Fill in the blanks below. 70 65- 60- 55- Amount of 50- 4s- money spent on 40- entertainment 35- (in dollars) 30- 25- 20- 15 10- 5+x 10 12 14 16 18 20 Number of hours worked (a) For these 25 students, as the number of hours increases, the amount of money spent tends to (Choose one) increase. decrease. t of correlation between the number of hours wor (b) For these 25 students, there is (Choose one) stay the same. money spent. (c) Using the line of best fit, we would predict that a student working 12 hours would spend approximately (Choose one) ▼
The scatter plot shows the number of hours worked and money spent on entertainment by each of 25 students. Also shown is the line of best fit for the data. Fill in the blanks below. 70 65- 60- 55- Amount of 50- 4s- money spent on 40- entertainment 35- (in dollars) 30- 25- 20- 15 10- 5+x 10 12 14 16 18 20 Number of hours worked (a) For these 25 students, as the number of hours increases, the amount of money spent tends to (Choose one) increase. decrease. t of correlation between the number of hours wor (b) For these 25 students, there is (Choose one) stay the same. money spent. (c) Using the line of best fit, we would predict that a student working 12 hours would spend approximately (Choose one) ▼

Big Ideas Math A Bridge To Success Algebra 1: Student Edition 2015
1st Edition
ISBN:9781680331141
Author:HOUGHTON MIFFLIN HARCOURT
Publisher:HOUGHTON MIFFLIN HARCOURT
Chapter4: Writing Linear Equations
Section: Chapter Questions
Problem 9CA

Related questions
Question
100%
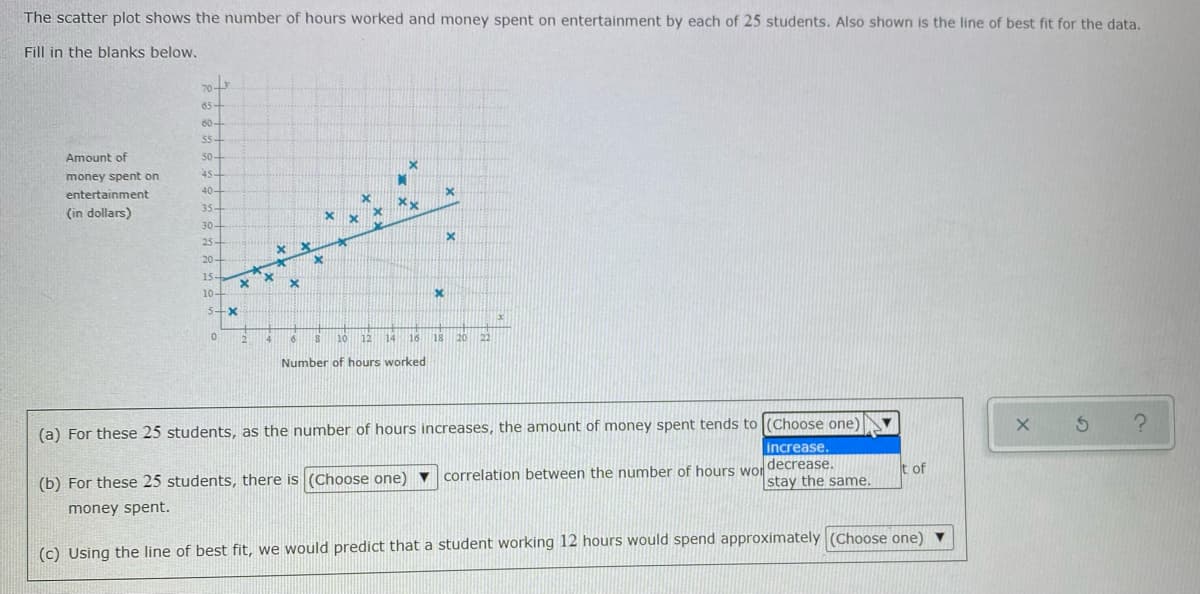
Transcribed Image Text:The scatter plot shows the number of hours worked and money spent on entertainment by each of 25 students. Also shown is the line of best fit for the data.
Fill in the blanks below.
70
65-
60-
55-
Amount of
50-
money spent on
40-
entertainment
35-
(in dollars)
30-
25-
20-
15
10-
5+x
10
14
16
18
20
Number of hours worked
(a) For these 25 students, as the number of hours increases, the amount of money spent tends to (Choose one)
increase.
decrease.
stay the same.
t of
correlation between the number of hours wor
(b) For these 25 students, there is (Choose one)
money spent.
(c) Using the line of best fit, we would predict that a student working 12 hours would spend approximately (Choose one) ▼
Expert Solution
This question has been solved!
Explore an expertly crafted, step-by-step solution for a thorough understanding of key concepts.

This is a popular solution!

Trending now
This is a popular solution!

Step by step
Solved in 2 steps with 1 images

Recommended textbooks for you
Big Ideas Math A Bridge To Success Algebra 1: Stu…
Algebra
ISBN:
9781680331141
Author:
HOUGHTON MIFFLIN HARCOURT
Publisher:
Houghton Mifflin Harcourt

Glencoe Algebra 1, Student Edition, 9780079039897…
Algebra
ISBN:
9780079039897
Author:
Carter
Publisher:
McGraw Hill

Algebra & Trigonometry with Analytic Geometry
Algebra
ISBN:
9781133382119
Author:
Swokowski
Publisher:
Cengage
Big Ideas Math A Bridge To Success Algebra 1: Stu…
Algebra
ISBN:
9781680331141
Author:
HOUGHTON MIFFLIN HARCOURT
Publisher:
Houghton Mifflin Harcourt
Glencoe Algebra 1, Student Edition, 9780079039897…
Algebra
ISBN:
9780079039897
Author:
Carter
Publisher:
McGraw Hill
Algebra & Trigonometry with Analytic Geometry
Algebra
ISBN:
9781133382119
Author:
Swokowski
Publisher:
Cengage

Functions and Change: A Modeling Approach to Coll…
Algebra
ISBN:
9781337111348
Author:
Bruce Crauder, Benny Evans, Alan Noell
Publisher:
Cengage Learning


Trigonometry (MindTap Course List)
Trigonometry
ISBN:
9781337278461
Author:
Ron Larson
Publisher:
Cengage Learning