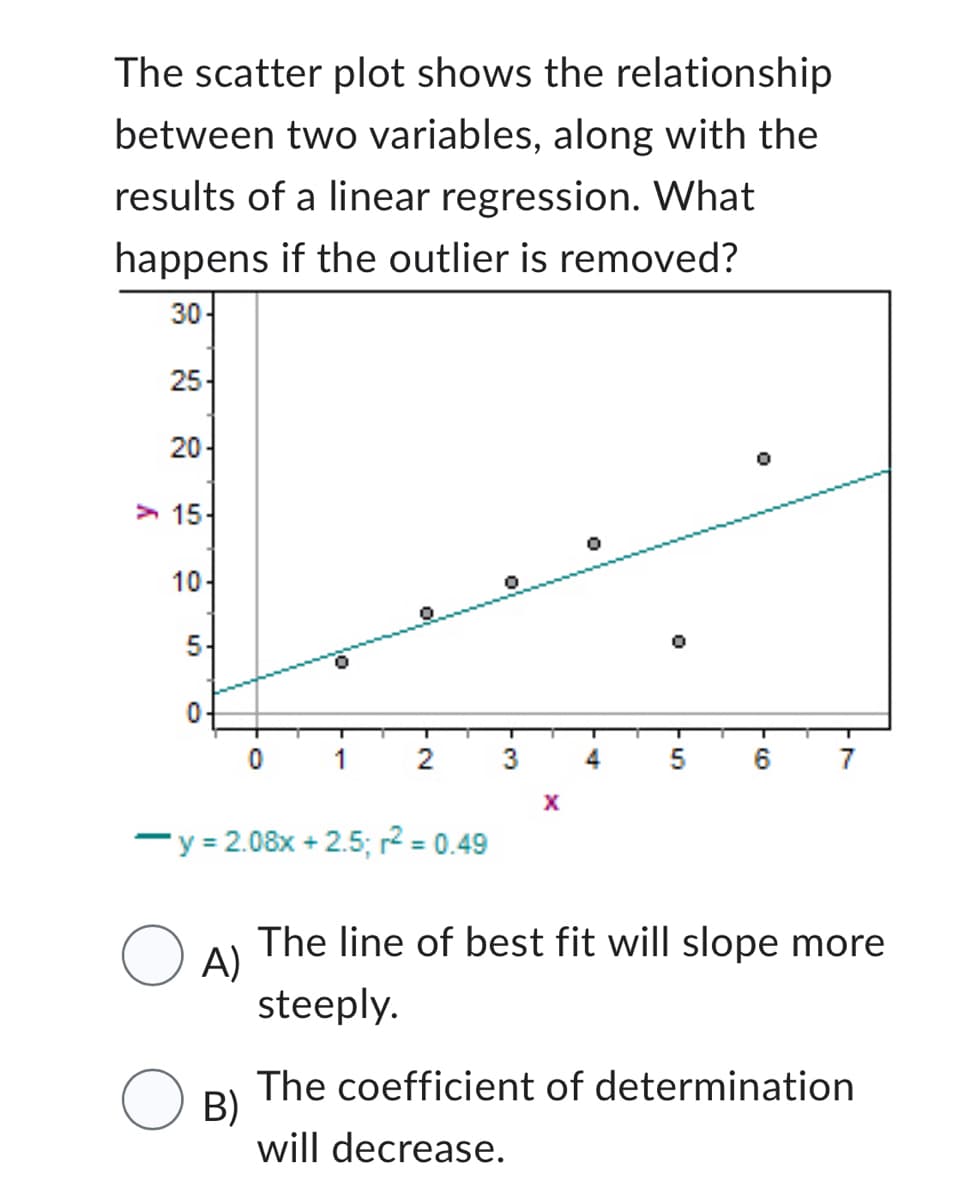
The scatter plot shows the relationship between two variables, along with the results of a linear regression. What happens if the outlier is removed? 30 25 20 15 10 5 1 2 3 4 5 6 -y=2.08x + 2.5; r² = 0.49 X 7
The scatter plot shows the relationship between two variables, along with the results of a linear regression. What happens if the outlier is removed? 30 25 20 15 10 5 1 2 3 4 5 6 -y=2.08x + 2.5; r² = 0.49 X 7

Chapter3: Polynomial Functions
Section: Chapter Questions
Problem 18T

Related questions
Question
Transcribed Image Text:The scatter plot shows the relationship
between two variables, along with the
results of a linear regression. What
happens if the outlier is removed?
30-
25-
20
15-
0
10-
5-
1
2
3
6
7
X
-y = 2.08x + 2.5; r² = 0.49
OA)
The line of best fit will slope more
steeply.
The coefficient of determination
B)
will decrease.
5
Transcribed Image Text:25
20
15
10
5
0
0
1
2
3
6
7
X
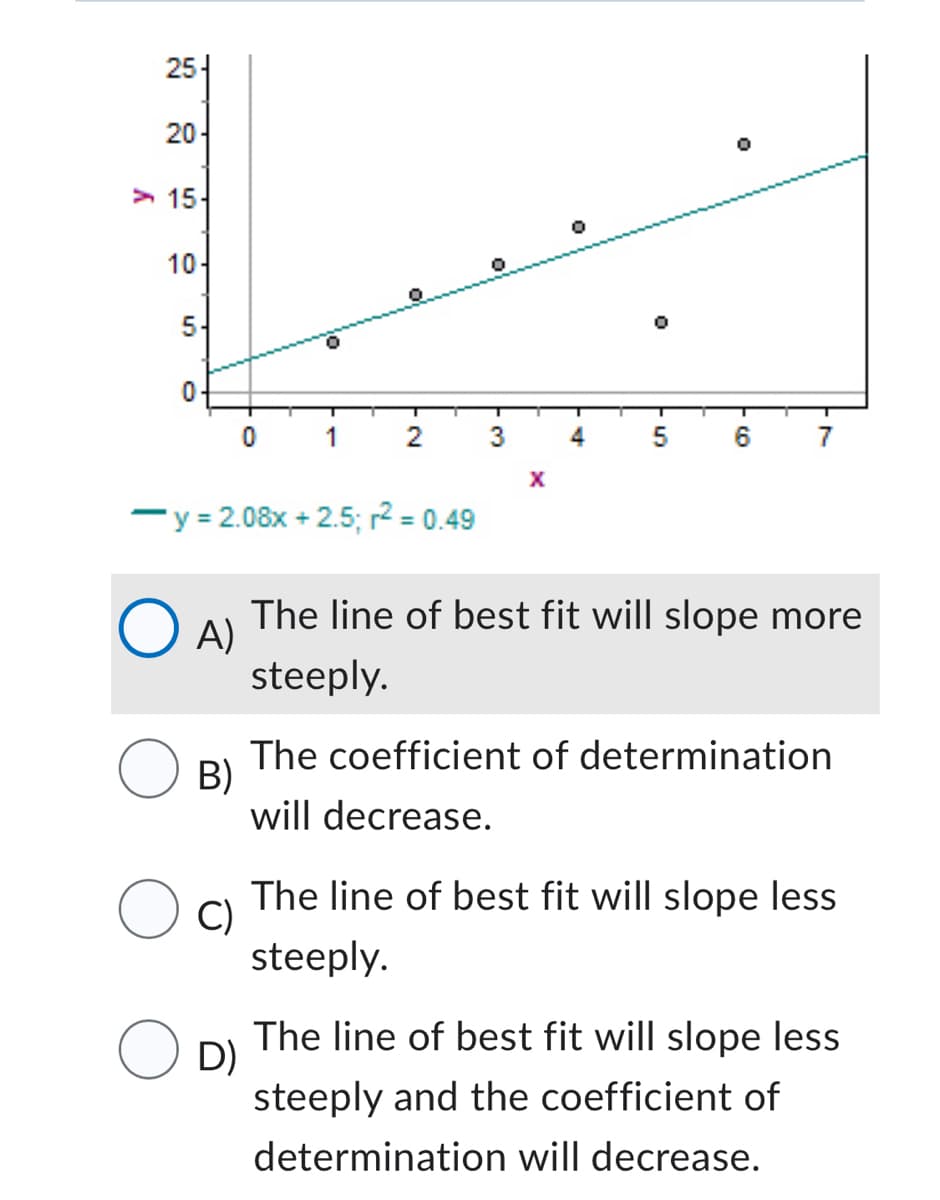
-y = 2.08x +2.5; r² = 0.49
OA)
The line of best fit will slope more
steeply.
B)
The coefficient of determination
will decrease.
O C
The line of best fit will slope less
steeply.
D)
The line of best fit will slope less
steeply and the coefficient of
determination will decrease.
0
O
55
Expert Solution
This question has been solved!
Explore an expertly crafted, step-by-step solution for a thorough understanding of key concepts.

Step by step
Solved in 2 steps with 2 images

Recommended textbooks for you

Functions and Change: A Modeling Approach to Coll…
Algebra
ISBN:
9781337111348
Author:
Bruce Crauder, Benny Evans, Alan Noell
Publisher:
Cengage Learning

Glencoe Algebra 1, Student Edition, 9780079039897…
Algebra
ISBN:
9780079039897
Author:
Carter
Publisher:
McGraw Hill
Functions and Change: A Modeling Approach to Coll…
Algebra
ISBN:
9781337111348
Author:
Bruce Crauder, Benny Evans, Alan Noell
Publisher:
Cengage Learning
Glencoe Algebra 1, Student Edition, 9780079039897…
Algebra
ISBN:
9780079039897
Author:
Carter
Publisher:
McGraw Hill

Big Ideas Math A Bridge To Success Algebra 1: Stu…
Algebra
ISBN:
9781680331141
Author:
HOUGHTON MIFFLIN HARCOURT
Publisher:
Houghton Mifflin Harcourt

Algebra & Trigonometry with Analytic Geometry
Algebra
ISBN:
9781133382119
Author:
Swokowski
Publisher:
Cengage

College Algebra
Algebra
ISBN:
9781305115545
Author:
James Stewart, Lothar Redlin, Saleem Watson
Publisher:
Cengage Learning