The shaded region between the graphs of y = – 2a² + 20 and y = 3x – 15 is displayed below in orange. 25 - 6 Ax - 40 The shaded region lies between æ = and x = A typical rectangle is shown in the diagram located at position x. What is the area of this rectangle, in terms of x? Δε Now find the total area of the orange shaded region. Write your answer in exact form. A =
The shaded region between the graphs of y = – 2a² + 20 and y = 3x – 15 is displayed below in orange. 25 - 6 Ax - 40 The shaded region lies between æ = and x = A typical rectangle is shown in the diagram located at position x. What is the area of this rectangle, in terms of x? Δε Now find the total area of the orange shaded region. Write your answer in exact form. A =

Algebra & Trigonometry with Analytic Geometry
13th Edition
ISBN:9781133382119
Author:Swokowski
Publisher:Swokowski
Chapter3: Functions And Graphs
Section: Chapter Questions
Problem 1DE

Related questions
Question
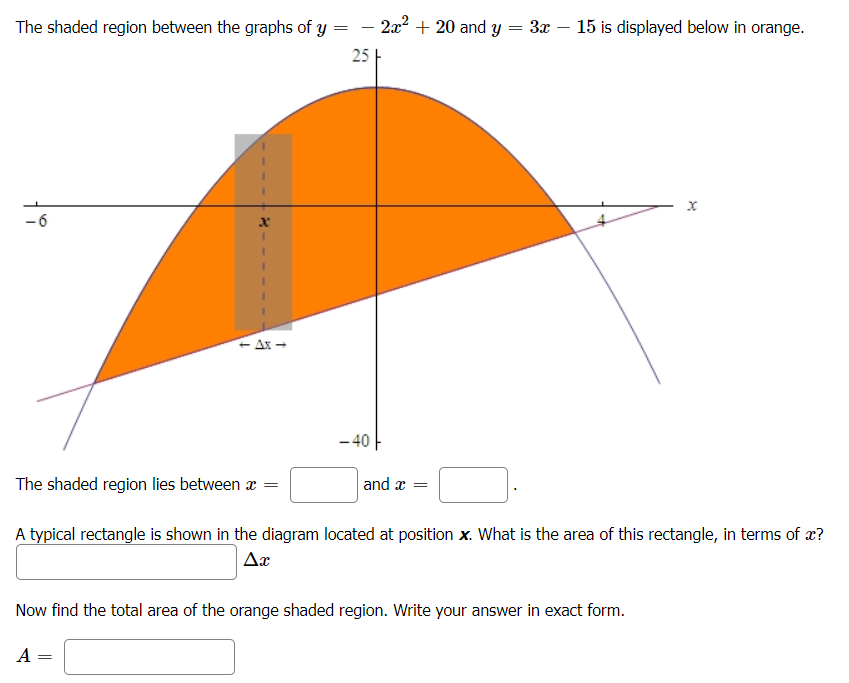
Transcribed Image Text:The shaded region between the graphs of y
– 2x? + 20 and y
3x – 15 is displayed below in orange.
|
25
-6
- Ax -
- 40
The shaded region lies between æ =
and x
A typical rectangle is shown in the diagram located at position x. What is the area of this rectangle, in terms of x?
Ar
Now find the total area of the orange shaded region. Write your answer in exact form.
A =
Expert Solution
This question has been solved!
Explore an expertly crafted, step-by-step solution for a thorough understanding of key concepts.

This is a popular solution!

Trending now
This is a popular solution!

Step by step
Solved in 5 steps with 5 images

Recommended textbooks for you
Algebra & Trigonometry with Analytic Geometry
Algebra
ISBN:
9781133382119
Author:
Swokowski
Publisher:
Cengage


Algebra & Trigonometry with Analytic Geometry
Algebra
ISBN:
9781133382119
Author:
Swokowski
Publisher:
Cengage

Elementary Geometry For College Students, 7e
Geometry
ISBN:
9781337614085
Author:
Alexander, Daniel C.; Koeberlein, Geralyn M.
Publisher:
Cengage,