The shaded region between the graphs of y = – 2x² + 20 and y = 3x - 15 is displayed below in orange. %3D 25 <-Ax- - 40 - and x = The shaded region lies between x = A typical rectangle is shown in the diagram located at position x. What is the height of this rectangle, in terms of x? Now find the total area of the orange shaded region. A
The shaded region between the graphs of y = – 2x² + 20 and y = 3x - 15 is displayed below in orange. %3D 25 <-Ax- - 40 - and x = The shaded region lies between x = A typical rectangle is shown in the diagram located at position x. What is the height of this rectangle, in terms of x? Now find the total area of the orange shaded region. A

Chapter5: Exponential And Logarithmic Functions
Section5.4: Exponential And Logarithmic Equations
Problem 83E: The number N of beavers in a given area after x years can be approximated by N=5.5100.23x,0x10. Use...

Related questions
Question
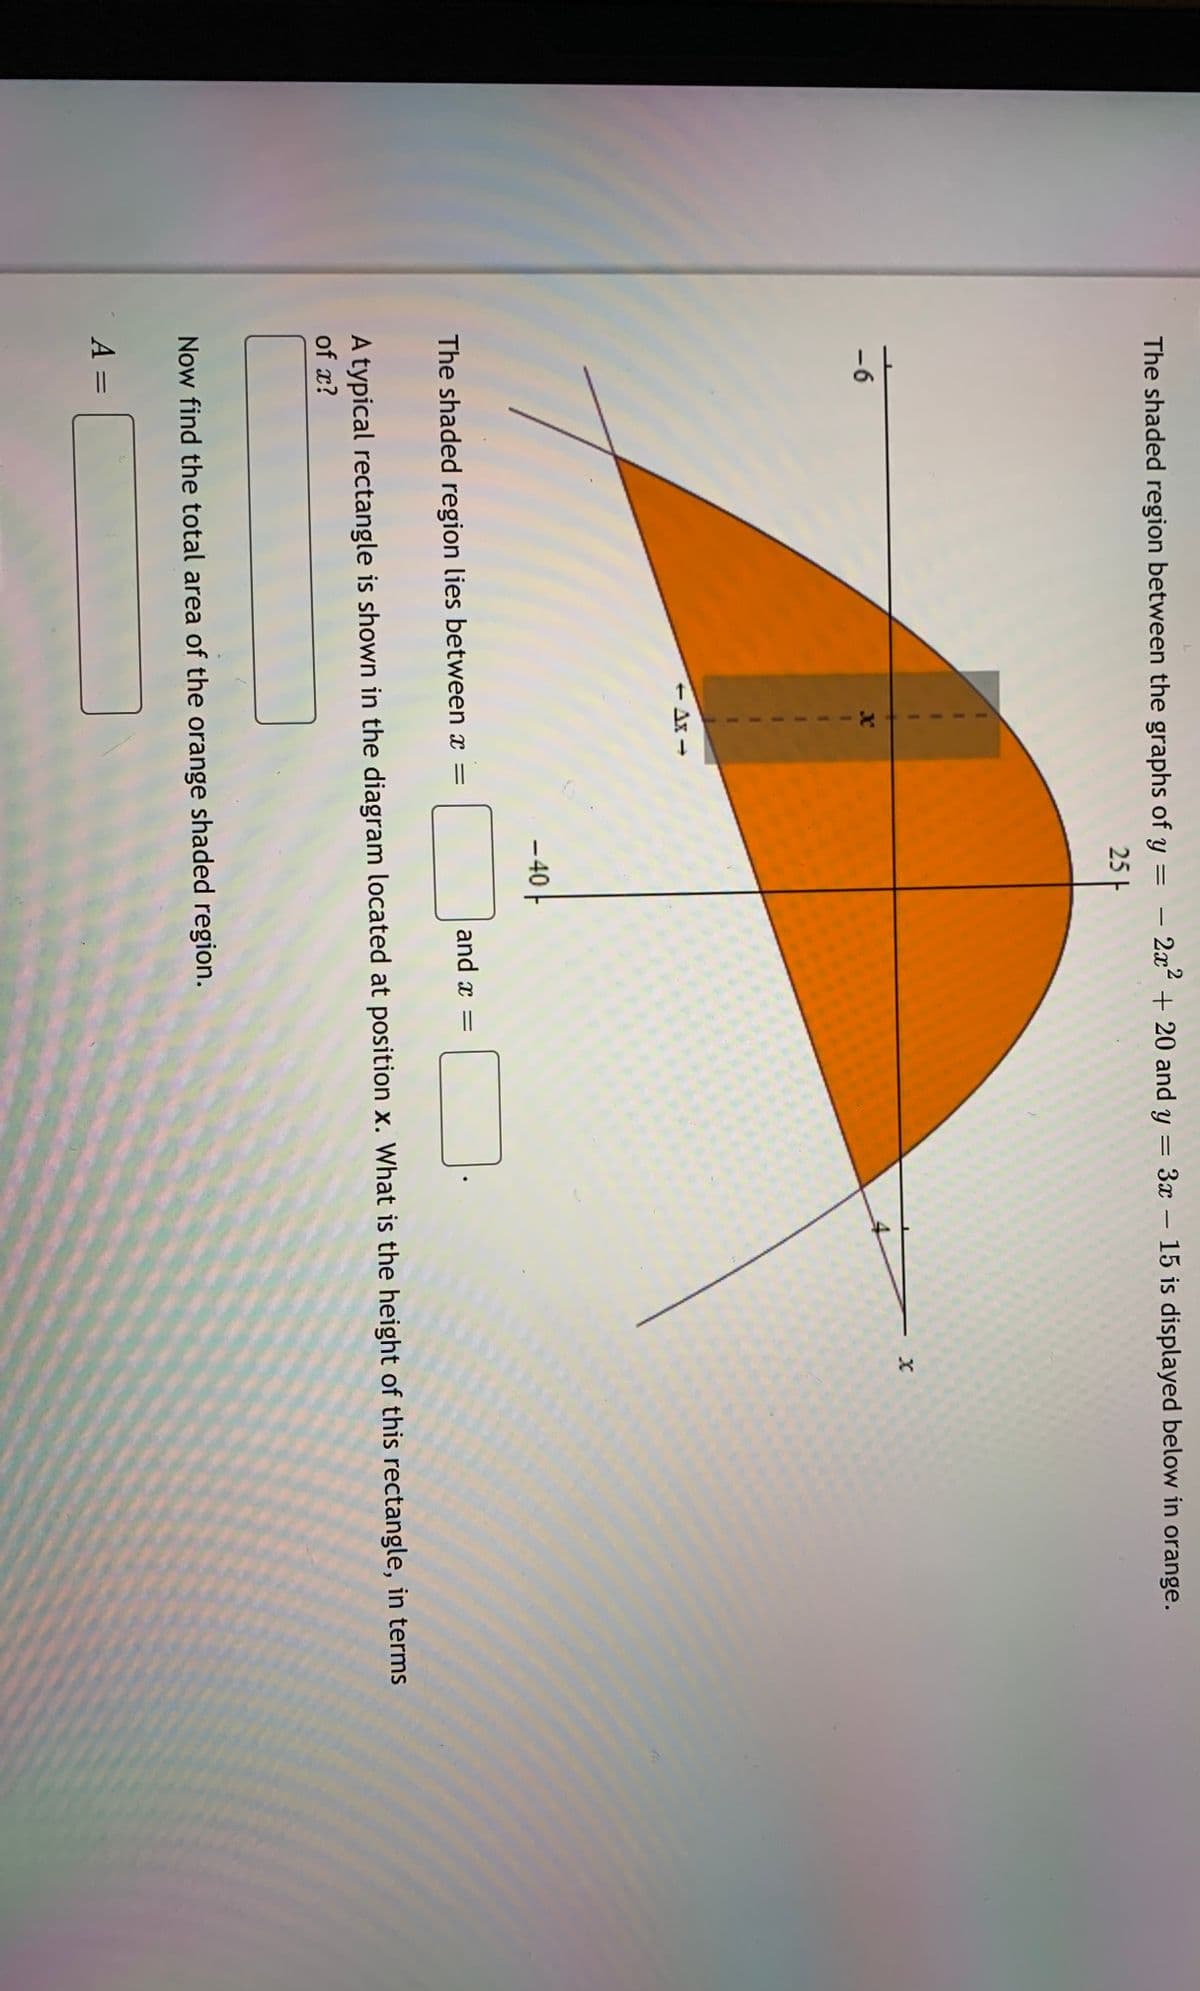
Transcribed Image Text:The shaded region between the graphs of y = – 2x² + 20 and y = 3x – 15 is displayed below in orange.
25 F
-6
+ Ax -
- 40
and x =
The shaded region lies between x =
A typical rectangle is shown in the diagram located at position x. What is the height of this rectangle, in terms
of x?
Now find the total area of the orange shaded region.
A
%3D
Expert Solution
This question has been solved!
Explore an expertly crafted, step-by-step solution for a thorough understanding of key concepts.

This is a popular solution!

Trending now
This is a popular solution!

Step by step
Solved in 2 steps

Recommended textbooks for you

Algebra & Trigonometry with Analytic Geometry
Algebra
ISBN:
9781133382119
Author:
Swokowski
Publisher:
Cengage
Algebra & Trigonometry with Analytic Geometry
Algebra
ISBN:
9781133382119
Author:
Swokowski
Publisher:
Cengage