The stem-and-leaf plot below shows the number of ga won for each of the 30 major league baseball teams 1998. NUMBER OF GAMES WON
The stem-and-leaf plot below shows the number of ga won for each of the 30 major league baseball teams 1998. NUMBER OF GAMES WON

Chapter8: Sequences, Series,and Probability
Section8.7: Probability
Problem 11ECP: A manufacturer has determined that a machine averages one faulty unit for every 500 it produces....

Related questions
Question
Answer this question correctly, deals with probability of simple events.
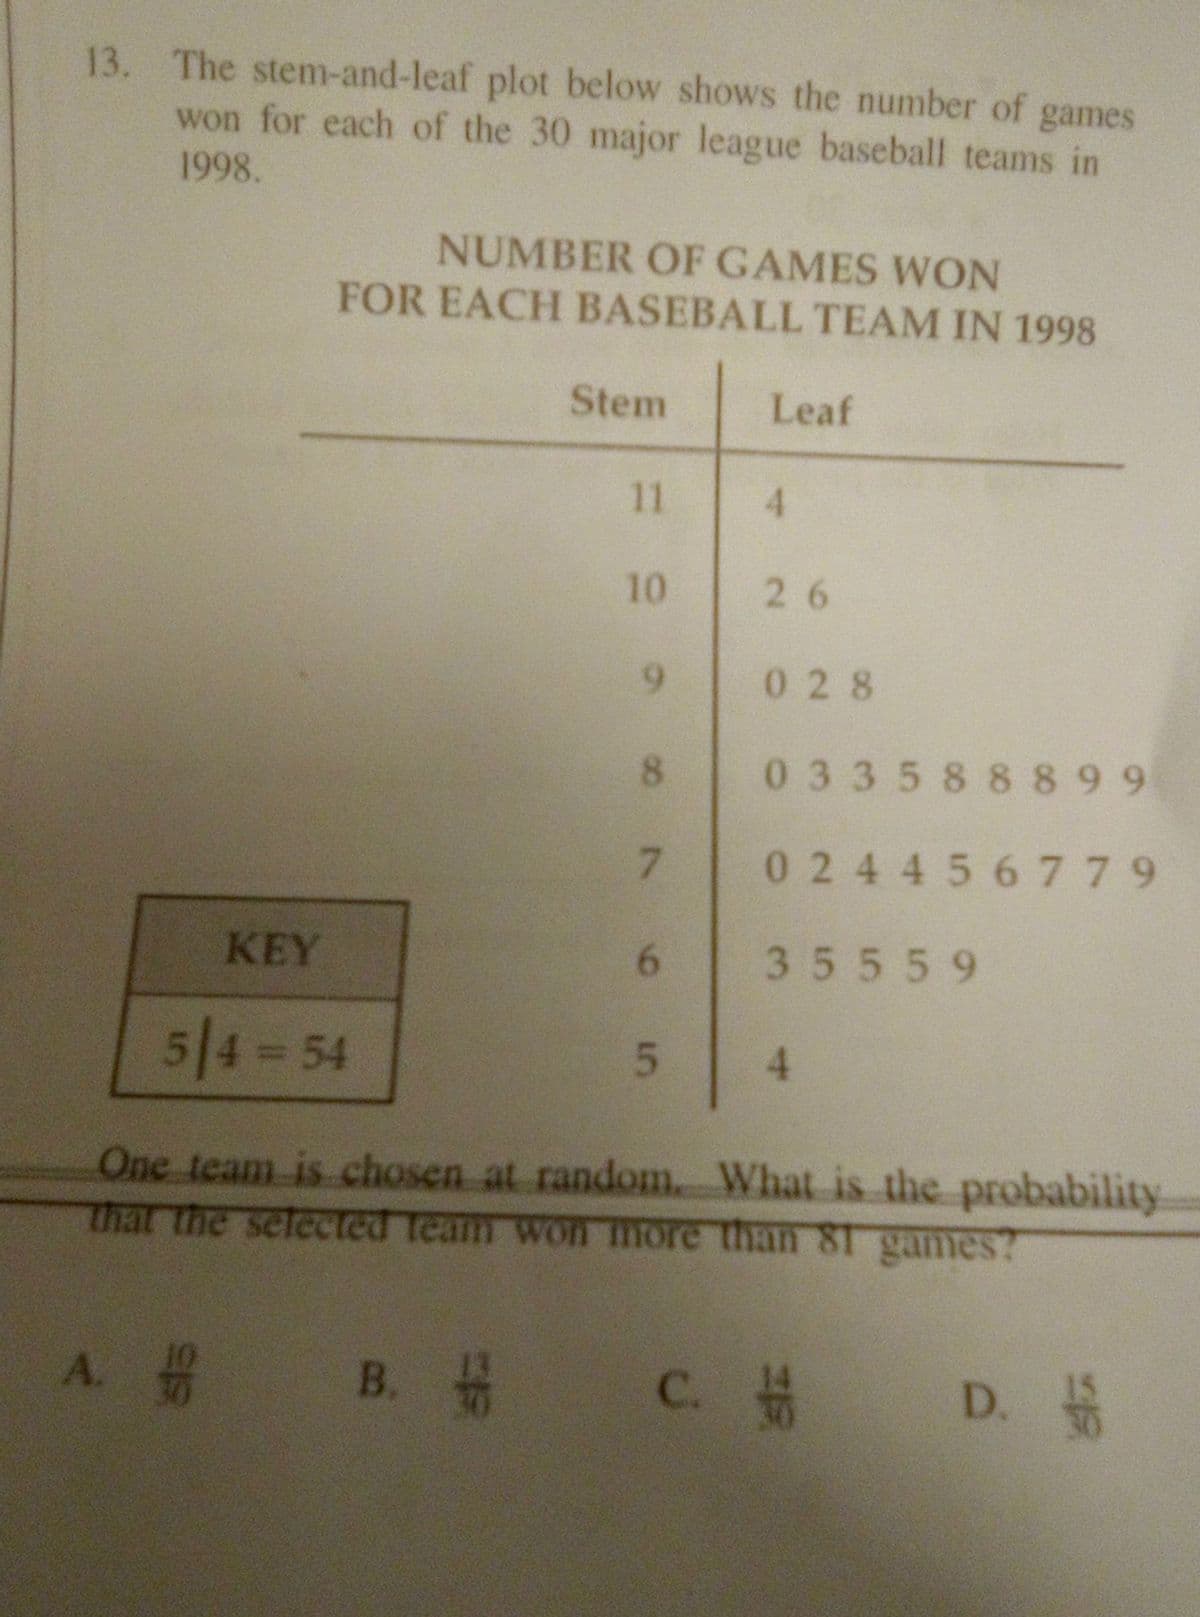
Transcribed Image Text:13. The stem-and-leaf plot below shows the number of games
won for each of the 30 major league baseball teams in
1998.
NUMBER OF GAMES WON
FOR EACH BASEBALL TEAM IN 1998
Stem
Leaf
11
4.
10
26
6.
028
8.
033588 899
7.
0 24456 779
KEY
35559
5/4-54
One team is chosen at random. What is the probability
that the selected team won more than 81 games?
A.
B.
C. # D.
4.
6
Expert Solution
This question has been solved!
Explore an expertly crafted, step-by-step solution for a thorough understanding of key concepts.

This is a popular solution!

Trending now
This is a popular solution!

Step by step
Solved in 2 steps

Recommended textbooks for you