The stock price of a company over a year is shown in the table below. The function Sis used to track the stock. S(1) = $19.50 represents the price per share after the first month (January). Stock Price Price per share Mont $19.50 1 $12.50 $7.50 3 $4.50 4 $3.50 $4.50 $7.50 7 $12.50 $19.50 $28.50 10 $39.50 11 $52.50 12 What can be concluded about the stock function S during the year? O Someone who bought stock at the price S(5) earned more money for the year than a person who bought at the price S(1). O Someone who invested in the stock at the beginning of the year had an overall loss for the year. O S(4) and S(6) represent the lowest stock price for the year. O S(11) represents the highest stock price for the year.
The stock price of a company over a year is shown in the table below. The function Sis used to track the stock. S(1) = $19.50 represents the price per share after the first month (January). Stock Price Price per share Mont $19.50 1 $12.50 $7.50 3 $4.50 4 $3.50 $4.50 $7.50 7 $12.50 $19.50 $28.50 10 $39.50 11 $52.50 12 What can be concluded about the stock function S during the year? O Someone who bought stock at the price S(5) earned more money for the year than a person who bought at the price S(1). O Someone who invested in the stock at the beginning of the year had an overall loss for the year. O S(4) and S(6) represent the lowest stock price for the year. O S(11) represents the highest stock price for the year.

College Algebra
7th Edition
ISBN:9781305115545
Author:James Stewart, Lothar Redlin, Saleem Watson
Publisher:James Stewart, Lothar Redlin, Saleem Watson
Chapter2: Functions
Section2.4: Average Rate Of Change Of A Function
Problem 37E: Three Was TieA downhill skiing race ends in a three-way tie for first place. The graph shows...

Related questions
Question
18
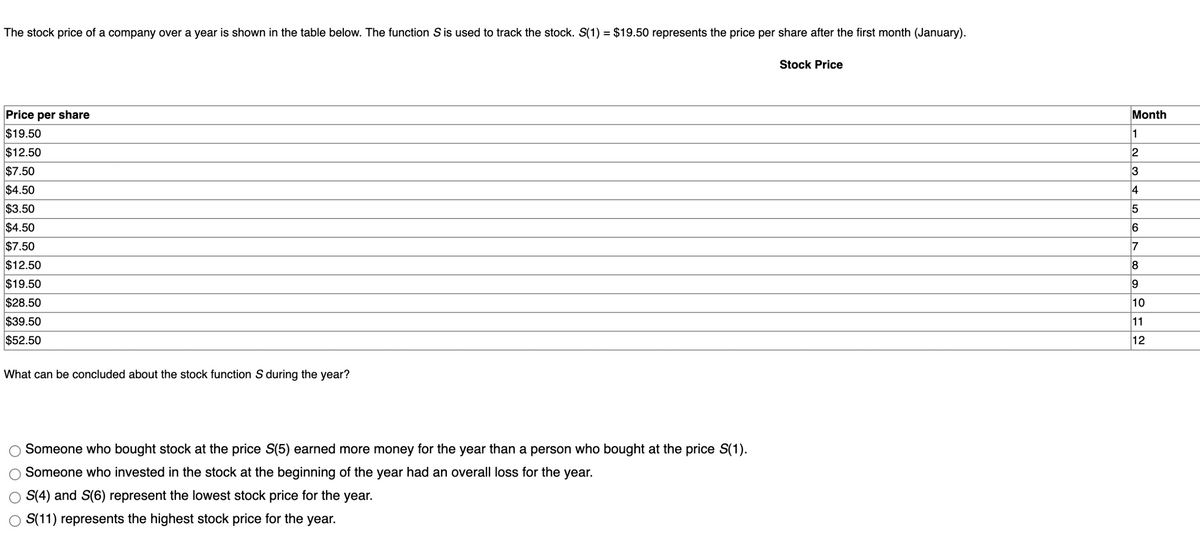
Transcribed Image Text:The stock price of a company over a year is shown in the table below. The function S is used to track the stock. S(1) = $19.50 represents the price per share after the first month (January).
Stock Price
Price per share
Month
$19.50
1
$12.50
2
$7.50
3
$4.50
4
$3.50
5
$4.50
6
$7.50
7
$12.50
$19.50
$28.50
10
$39.50
11
$52.50
12
What can be concluded about the stock function S during the year?
Someone who bought stock at the price S(5) earned more money for the year than a person who bought at the price S(1).
Someone who invested in the stock at the beginning of the year had an overall loss for the year.
S(4) and S(6) represent the lowest stock price for the year.
S(11) represents the highest stock price for the year.
Expert Solution
This question has been solved!
Explore an expertly crafted, step-by-step solution for a thorough understanding of key concepts.

Step by step
Solved in 3 steps

Recommended textbooks for you
College Algebra
Algebra
ISBN:
9781305115545
Author:
James Stewart, Lothar Redlin, Saleem Watson
Publisher:
Cengage Learning

Glencoe Algebra 1, Student Edition, 9780079039897…
Algebra
ISBN:
9780079039897
Author:
Carter
Publisher:
McGraw Hill

Functions and Change: A Modeling Approach to Coll…
Algebra
ISBN:
9781337111348
Author:
Bruce Crauder, Benny Evans, Alan Noell
Publisher:
Cengage Learning
College Algebra
Algebra
ISBN:
9781305115545
Author:
James Stewart, Lothar Redlin, Saleem Watson
Publisher:
Cengage Learning
Glencoe Algebra 1, Student Edition, 9780079039897…
Algebra
ISBN:
9780079039897
Author:
Carter
Publisher:
McGraw Hill
Functions and Change: A Modeling Approach to Coll…
Algebra
ISBN:
9781337111348
Author:
Bruce Crauder, Benny Evans, Alan Noell
Publisher:
Cengage Learning


Big Ideas Math A Bridge To Success Algebra 1: Stu…
Algebra
ISBN:
9781680331141
Author:
HOUGHTON MIFFLIN HARCOURT
Publisher:
Houghton Mifflin Harcourt
