The supply and demand curves for a product are given by the following equations: P = aQs +b and P = cQD +d where Qs is the quantity supplied, Qp is the quantity demanded, P is the price of the product, and a, b, c and d are constarts. Part A Give a definition of supply and demand curves and explain what is meant by equilibrium price and equilibrium quantity. Give an explanation in context, considering the equations above and supporting your explanations with the use of appropriate graphs. State the range of values of the parameters a, b, c and d giving reasons based on supply and demand economic theories. Part B The equation of the demand function for luxury sparkling wine is given by QD where Qp is the number of bottles demanded weekly and P is the price per bottle in euros. From a market analysis was found that: = 1520-5P The price of each bottle increases by € 2.65 for every extra 10 bottles produced, and The number of bottles produced is the same as the number of bottles bought when their price per bottle is € 184. Sketch both the supply and the demand curve for sparkling wine on the same graph labelling the equilibrium point and any intersections with the axis. You need to label each axis and give the equation for the curves in the form P = f(Q). You also need to show all your working and give full explanations in your own words. Part C Using the supply and demand curves given in Part B, determine the effect on the market equilibrium if a fixed tax of € (10 + N) is introduced on the production of each bottle of wine. Here N is the last digit of your ID number.
The supply and demand curves for a product are given by the following equations: P = aQs +b and P = cQD +d where Qs is the quantity supplied, Qp is the quantity demanded, P is the price of the product, and a, b, c and d are constarts. Part A Give a definition of supply and demand curves and explain what is meant by equilibrium price and equilibrium quantity. Give an explanation in context, considering the equations above and supporting your explanations with the use of appropriate graphs. State the range of values of the parameters a, b, c and d giving reasons based on supply and demand economic theories. Part B The equation of the demand function for luxury sparkling wine is given by QD where Qp is the number of bottles demanded weekly and P is the price per bottle in euros. From a market analysis was found that: = 1520-5P The price of each bottle increases by € 2.65 for every extra 10 bottles produced, and The number of bottles produced is the same as the number of bottles bought when their price per bottle is € 184. Sketch both the supply and the demand curve for sparkling wine on the same graph labelling the equilibrium point and any intersections with the axis. You need to label each axis and give the equation for the curves in the form P = f(Q). You also need to show all your working and give full explanations in your own words. Part C Using the supply and demand curves given in Part B, determine the effect on the market equilibrium if a fixed tax of € (10 + N) is introduced on the production of each bottle of wine. Here N is the last digit of your ID number.

Linear Algebra: A Modern Introduction
4th Edition
ISBN:9781285463247
Author:David Poole
Publisher:David Poole
Chapter2: Systems Of Linear Equations
Section2.4: Applications
Problem 23EQ:
23. Consider a simple economy with just two industries: farming and manufacturing. Farming consumes...

Related questions
Question
100%
please send handwritten solution for part a
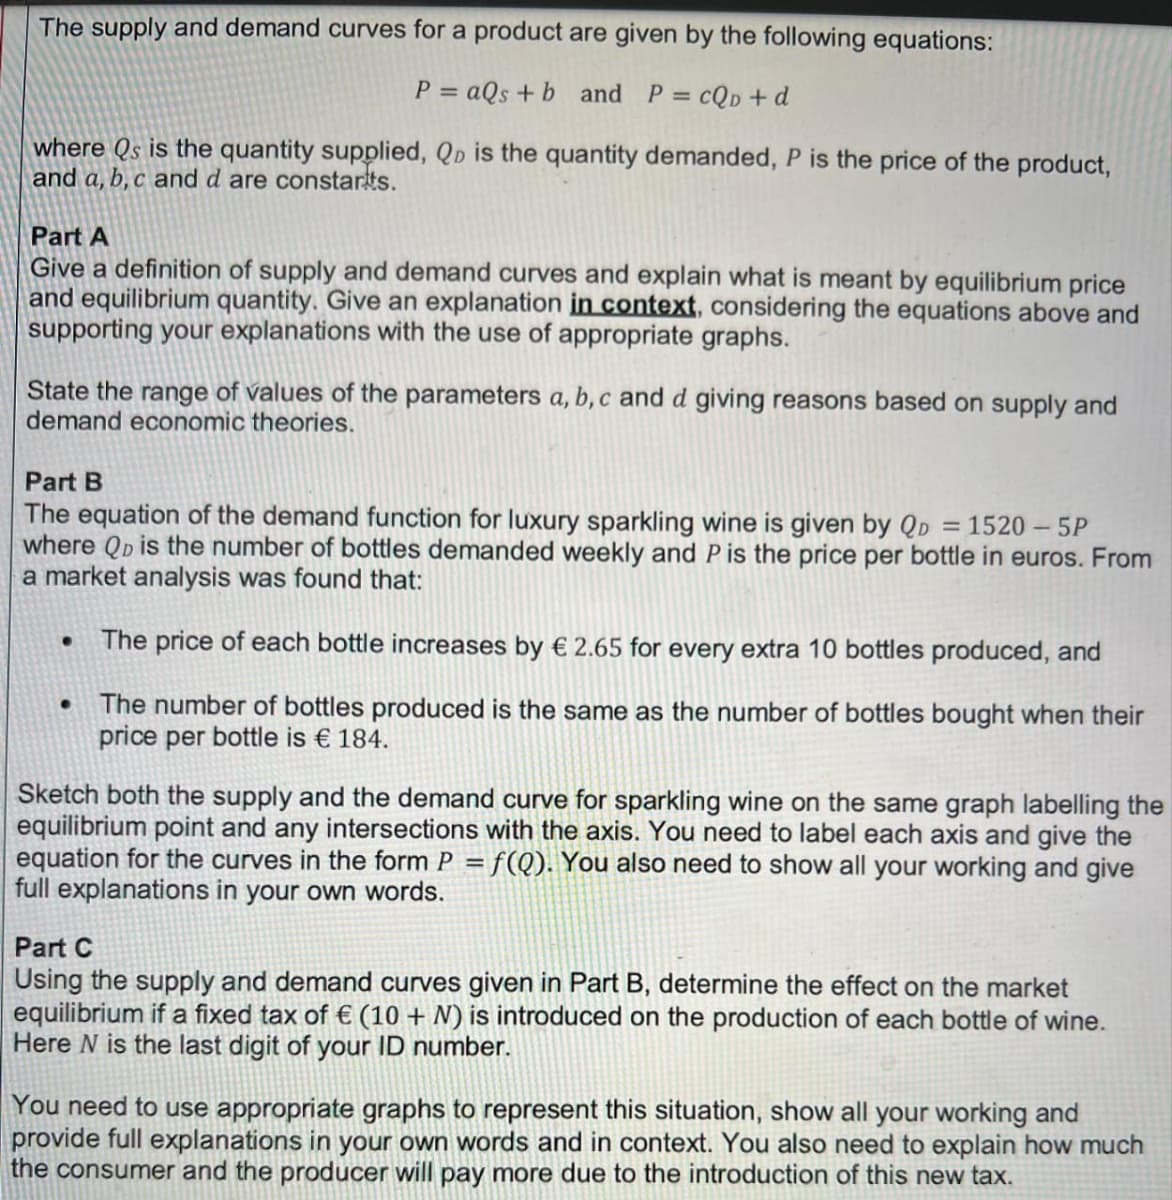
Transcribed Image Text:The supply and demand curves for a product are given by the following equations:
P = aQs + b and P =
cQD + d
where Qs is the quantity supplied, Qp is the quantity demanded, P is the price of the product,
and a, b, c and d are constarts.
Part A
Give a definition of supply and demand curves and explain what is meant by equilibrium price
and equilibrium quantity. Give an explanation in context, considering the equations above and
supporting your explanations with the use of appropriate graphs.
State the range of values of the parameters a, b, c and d giving reasons based on supply and
demand economic theories.
Part B
The equation of the demand function for luxury sparkling wine is given by QD = 1520 – 5P
where QD is the number of bottles demanded weekly and P is the price per bottle in euros. From
a market analysis was found that:
The price of each bottle increases by € 2.65 for every extra 10 bottles produced, and
The number of bottles produced is the same as the number of bottles bought when their
price per bottle is € 184.
Sketch both the supply and the demand curve for sparkling wine on the same graph labelling the
equilibrium point and any intersections with the axis. You need to label each axis and give the
equation for the curves in the form P = f(Q). You also need to show all your working and give
full explanations in your own words.
Part C
Using the supply and demand curves given in Part B, determine the effect on the market
equilibrium if a fixed tax of € (10 + N) is introduced on the production of each bottle of wine.
Here N is the last digit of your ID number.
You need to use appropriate graphs to represent this situation, show all your working and
provide full explanations in your own words and in context. You also need to explain how much
the consumer and the producer will pay more due to the introduction of this new tax.
Expert Solution
This question has been solved!
Explore an expertly crafted, step-by-step solution for a thorough understanding of key concepts.

This is a popular solution!

Trending now
This is a popular solution!

Step by step
Solved in 2 steps with 2 images

Recommended textbooks for you
Linear Algebra: A Modern Introduction
Algebra
ISBN:
9781285463247
Author:
David Poole
Publisher:
Cengage Learning

Linear Algebra: A Modern Introduction
Algebra
ISBN:
9781285463247
Author:
David Poole
Publisher:
Cengage Learning