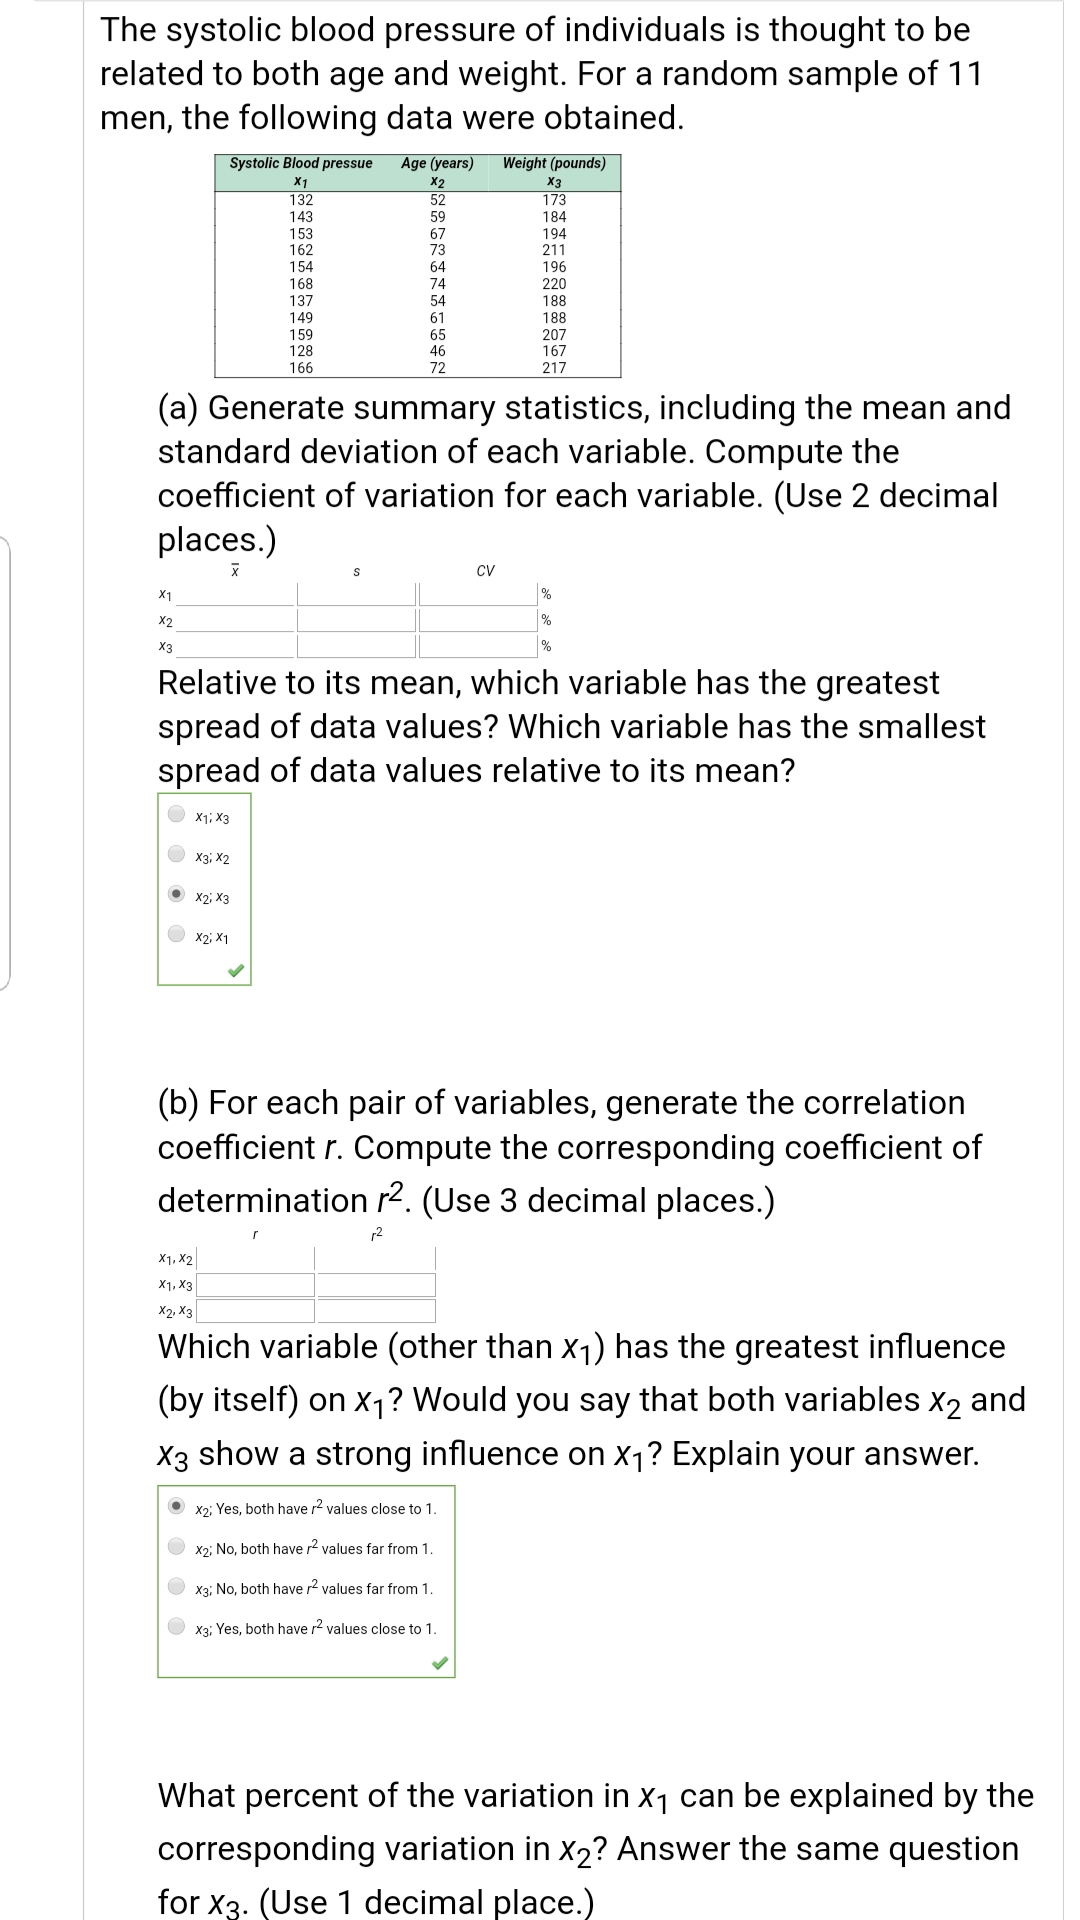
The systolic blood pressure of individuals is thought to be related to both age and weight. For a random sample of 11 men, the following data were obtained. Systolic Blood pressue Age (years) Weight (pounds) X1 X2 52 59 67 73 X3 132 173 143 184 153 162 194 154 168 137 149 159 211 196 220 188 188 207 167 217 64 74 54 61 65 46 128 166 72 (a) Generate summary statistics, including the mean and standard deviation of each variable. Compute the coefficient of variation for each variable. (Use 2 decimal places.) CV X1 % X2 % X3 % Relative to its mean, which variable has the greatest spread of data values? Which variable has the smallest spread of data values relative to its mean? X1, X3 X3, X2 O x2; X3 X2, X1 (b) For each pair of variables, generate the correlation coefficient r. Compute the corresponding coefficient of determination r2. (Use 3 decimal places.)
The systolic blood pressure of individuals is thought to be related to both age and weight. For a random sample of 11 men, the following data were obtained. Systolic Blood pressue Age (years) Weight (pounds) X1 X2 52 59 67 73 X3 132 173 143 184 153 162 194 154 168 137 149 159 211 196 220 188 188 207 167 217 64 74 54 61 65 46 128 166 72 (a) Generate summary statistics, including the mean and standard deviation of each variable. Compute the coefficient of variation for each variable. (Use 2 decimal places.) CV X1 % X2 % X3 % Relative to its mean, which variable has the greatest spread of data values? Which variable has the smallest spread of data values relative to its mean? X1, X3 X3, X2 O x2; X3 X2, X1 (b) For each pair of variables, generate the correlation coefficient r. Compute the corresponding coefficient of determination r2. (Use 3 decimal places.)
Glencoe Algebra 1, Student Edition, 9780079039897, 0079039898, 2018
18th Edition
ISBN:9780079039897
Author:Carter
Publisher:Carter
Chapter10: Statistics
Section10.5: Comparing Sets Of Data
Problem 3CYU
Related questions
Topic Video
Question

Transcribed Image Text:The systolic blood pressure of individuals is thought to be
related to both age and weight. For a random sample of 11
men, the following data were obtained.
Systolic Blood pressue
Age (years)
Weight (pounds)
X1
X2
52
59
67
73
X3
132
173
143
184
153
162
194
154
168
137
149
159
211
196
220
188
188
207
167
217
64
74
54
61
65
46
128
166
72
(a) Generate summary statistics, including the mean and
standard deviation of each variable. Compute the
coefficient of variation for each variable. (Use 2 decimal
places.)
CV
X1
%
X2
%
X3
%
Relative to its mean, which variable has the greatest
spread of data values? Which variable has the smallest
spread of data values relative to its mean?
X1, X3
X3, X2
O x2; X3
X2, X1
(b) For each pair of variables, generate the correlation
coefficient r. Compute the corresponding coefficient of
determination r2. (Use 3 decimal places.)
Expert Solution
This question has been solved!
Explore an expertly crafted, step-by-step solution for a thorough understanding of key concepts.
This is a popular solution!
Trending now
This is a popular solution!
Step by step
Solved in 5 steps with 8 images

Knowledge Booster
Learn more about
Need a deep-dive on the concept behind this application? Look no further. Learn more about this topic, probability and related others by exploring similar questions and additional content below.Recommended textbooks for you

Glencoe Algebra 1, Student Edition, 9780079039897…
Algebra
ISBN:
9780079039897
Author:
Carter
Publisher:
McGraw Hill

Glencoe Algebra 1, Student Edition, 9780079039897…
Algebra
ISBN:
9780079039897
Author:
Carter
Publisher:
McGraw Hill