The table below contains a sample of points from linear functions. Y1 and Y2. Used to solve the inequality Y1>Y2 Express your answer as an inequality
The table below contains a sample of points from linear functions. Y1 and Y2. Used to solve the inequality Y1>Y2 Express your answer as an inequality

Algebra & Trigonometry with Analytic Geometry
13th Edition
ISBN:9781133382119
Author:Swokowski
Publisher:Swokowski
Chapter10: Sequences, Series, And Probability
Section10.8: Probability
Problem 31E

Related questions
Question
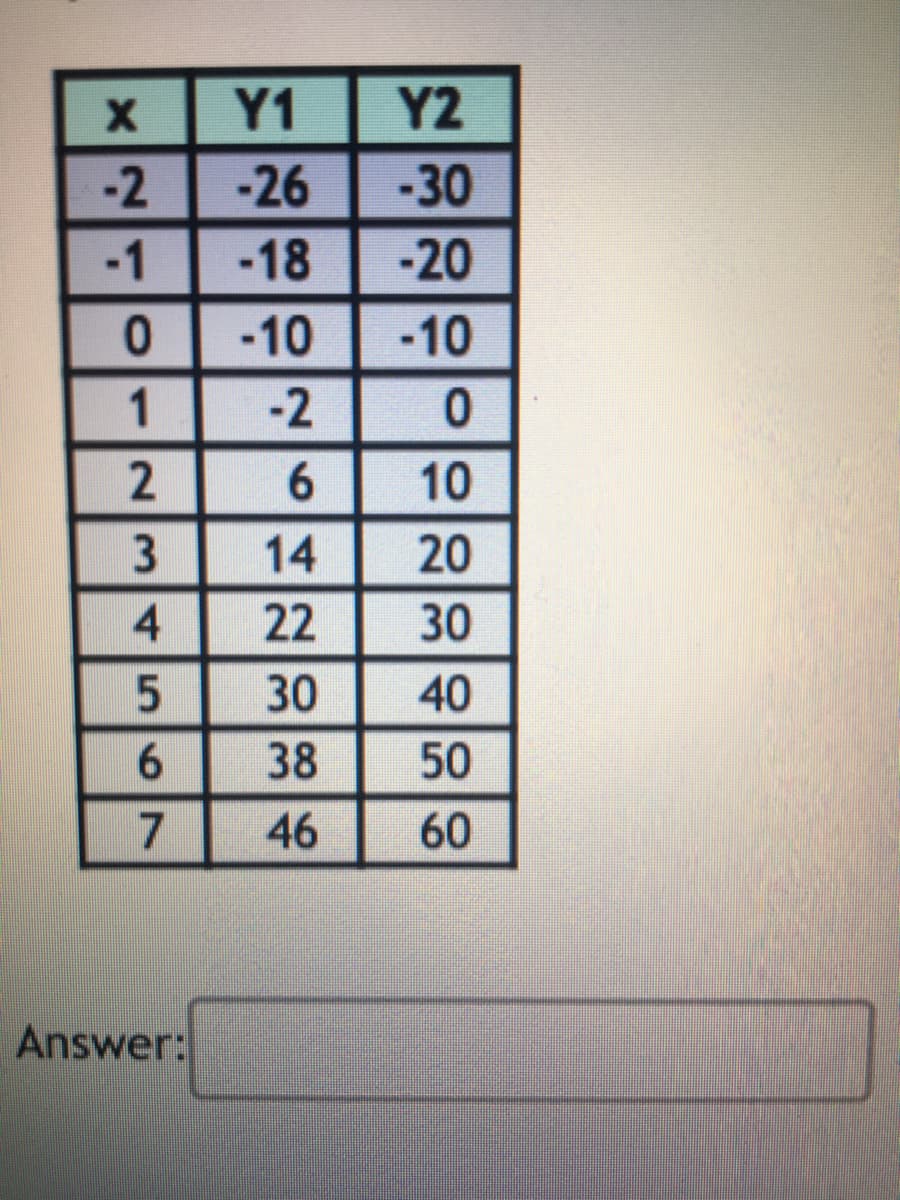
The table below contains a sample of points from linear functions. Y1 and Y2. Used to solve the inequality Y1>Y2
Express your answer as an inequality.
Transcribed Image Text:Y1
Y2
-2
-26
-30
-1
-18
-20
-10
-10
1
-2
6.
10
3
14
20
22
30
30
40
38
50
7
46
60
Answer:
456N
Expert Solution
This question has been solved!
Explore an expertly crafted, step-by-step solution for a thorough understanding of key concepts.

This is a popular solution!

Trending now
This is a popular solution!

Step by step
Solved in 2 steps

Knowledge Booster


Learn more about
Need a deep-dive on the concept behind this application? Look no further. Learn more about this topic, advanced-math and related others by exploring similar questions and additional content below.Recommended textbooks for you
Algebra & Trigonometry with Analytic Geometry
Algebra
ISBN:
9781133382119
Author:
Swokowski
Publisher:
Cengage
Algebra & Trigonometry with Analytic Geometry
Algebra
ISBN:
9781133382119
Author:
Swokowski
Publisher:
Cengage