The table below gives the annual sales (in millions) of a product. A 1998 1999 2000 2001 2002 2003 2004 2005 year 2006 2007 2008 2009 2010 2011 2012 2013 2014 2015 20 sales 135 153 167 177 183 185 183 177 167 153 135 113 87 57 23 -15 -57 -103 -1 What was the average rate of change of annual sales a) Between 2009 and 2010 b) Between 2009 and 2015 millions of dollars/year millions of dollars/year
The table below gives the annual sales (in millions) of a product. A 1998 1999 2000 2001 2002 2003 2004 2005 year 2006 2007 2008 2009 2010 2011 2012 2013 2014 2015 20 sales 135 153 167 177 183 185 183 177 167 153 135 113 87 57 23 -15 -57 -103 -1 What was the average rate of change of annual sales a) Between 2009 and 2010 b) Between 2009 and 2015 millions of dollars/year millions of dollars/year

Chapter3: Functions
Section3.3: Rates Of Change And Behavior Of Graphs
Problem 26SE: Table 3 gives the annual sales (in millions of dollars) of a product from 1998 to 20006. What was...

Related questions
Question
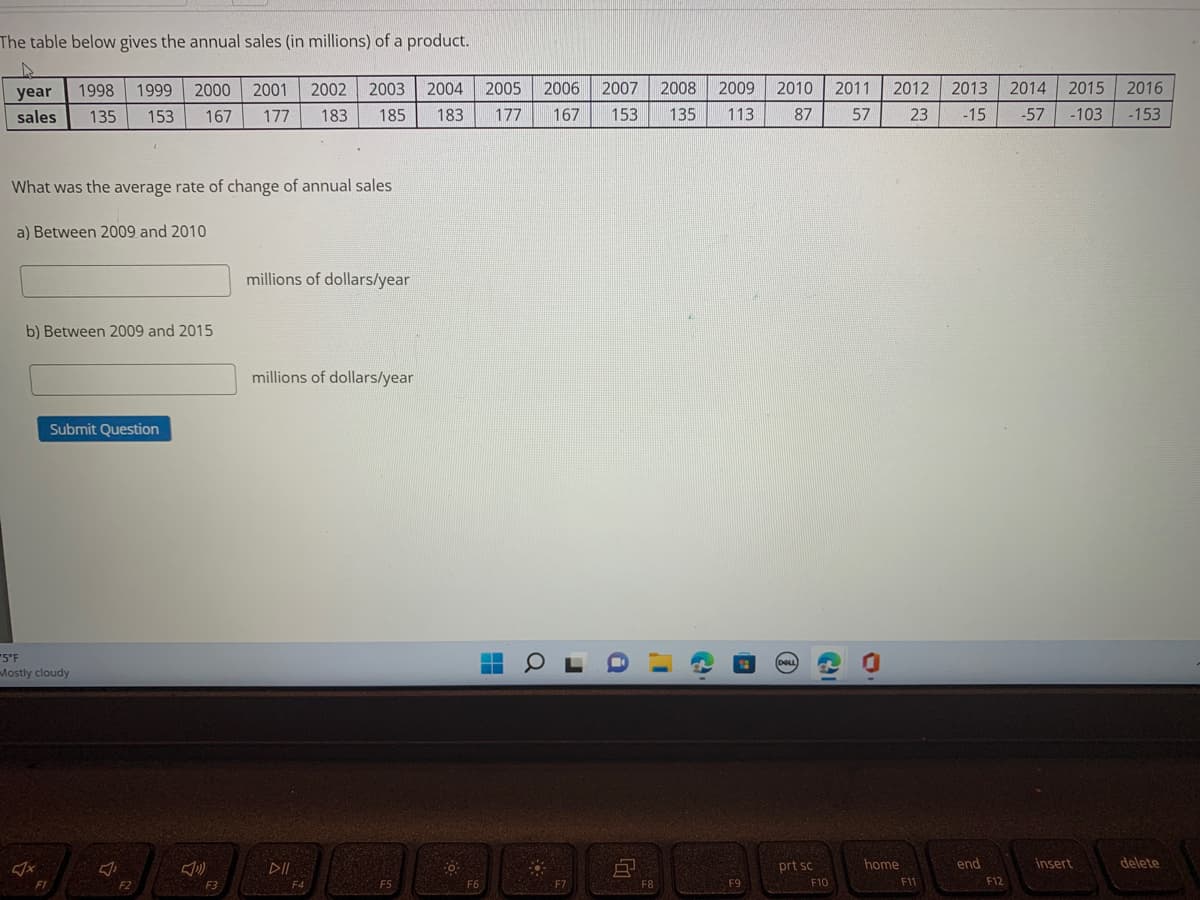
Transcribed Image Text:The table below gives the annual sales (in millions) of a product.
A
1998 1999 2000
2000 2001 2002 2003 2004
year
sales 135 153 167 177 183 185 183
What was the average rate of change of annual sales
a) Between 2009 and 2010
b) Between 2009 and 2015
-5°F
Mostly cloudy
Jx
Submit Question
F1
F2
F3
millions of dollars/year
millions of dollars/year
F4
F5
F6
2005
2006
2007
177 167 153
H
a
F7
i
8
2008
I'
F8
2009
135 113
F9
2010
87
(DELL)
prt sc
2011
57
Cal
O
F10
2012
2013 2014 2015 2016
23 -15 -57 -103 -153
home
F11
end
F12
insert
delete
Expert Solution
This question has been solved!
Explore an expertly crafted, step-by-step solution for a thorough understanding of key concepts.

Step by step
Solved in 3 steps with 3 images

Recommended textbooks for you

Trigonometry (MindTap Course List)
Trigonometry
ISBN:
9781337278461
Author:
Ron Larson
Publisher:
Cengage Learning

Trigonometry (MindTap Course List)
Trigonometry
ISBN:
9781337278461
Author:
Ron Larson
Publisher:
Cengage Learning

Algebra & Trigonometry with Analytic Geometry
Algebra
ISBN:
9781133382119
Author:
Swokowski
Publisher:
Cengage

Algebra and Trigonometry (MindTap Course List)
Algebra
ISBN:
9781305071742
Author:
James Stewart, Lothar Redlin, Saleem Watson
Publisher:
Cengage Learning

Glencoe Algebra 1, Student Edition, 9780079039897…
Algebra
ISBN:
9780079039897
Author:
Carter
Publisher:
McGraw Hill