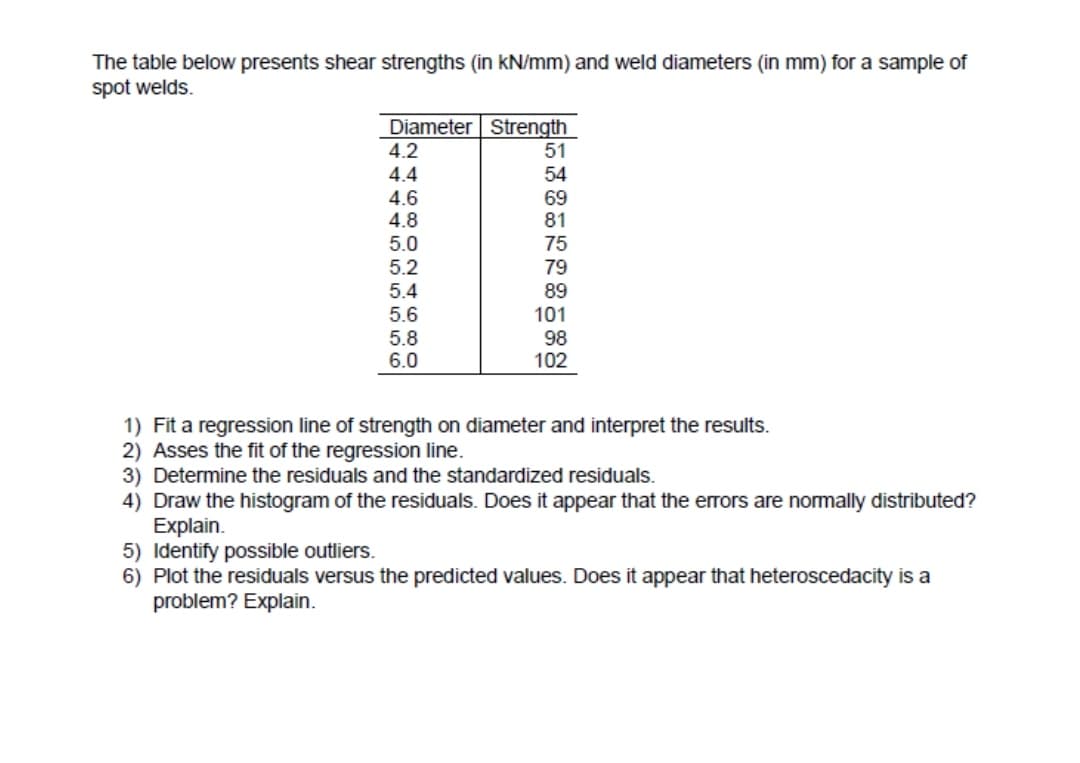
The table below presents shear strengths (in kN/mm) and weld diameters (in mm) for a sample of spot welds. Diameter Strength 51 54 69 81 75 4.2 4.4 4.6 4.8 5.0 5.2 5.4 5.6 79 89 101


Q: Calculate the average value of f (x, y) = e^(x+y) on the square [0, 1]×[0, 1].
A: Known formula: Average value of the function fx, y over R is given by favg=1Area of R ∫x1x2 ∫y1y2…
Q: Exercise (4): Find the average value of functionf (x, y) = 18xy on the rectangle R= (0,2] x [0,3]…
A:
Q: Calculate the average value of f (x, y) = ex+y on the square[0, 1]×[0, 1].
A: The average of a function in 2 variables is calculated by first taking the double integral of the…
Q: Q11) What is the total & lateral surface area o figure below? (Round to the nearest hundrec 2.9 ft…
A: given,
Q: Calculate the bulk density (g/cc) of a soil using the following values; a. Weight of core= 150 g b.…
A: Please check step 2 for the solution.
Q: What is the average value of the function f(x, y) = x + 2y2 over the region described by 0< x <1 and…
A: The formula to find the average value in the given region is Avg=1A∬Rfx,ydxdy where, A=area in the…
Q: If the object below has a uniform mass distribution, a=2 m, b = 4 m and c = 8 m, find the centre of…
A: Redraw the figure completing the whole rectangle as shown:
Q: Exercise (4): Find the average value of functionf (x,y) = 18xy on the rectangle R = [0,2] × [0,3]…
A:
Q: What would the height need to be for this curve to b density curve? 20 1 9. 10 11 12 13 14 15 16 17…
A:
Q: Consider the density curve plotted below: Density Curve 0.275 0.25 -0.225 0.2 0.175 0.15 0.125 0.1…
A:
Q: Find the average value of ƒ(x, y) = xy over the regions. The quarter-circle x2+ y2 ≤1 in the first…
A: Consider the function f(x, y) change it to polar coordinates x=r cos θ, y=r sin θ Now for f(r, θ)…
Q: Find the average value of the function f(x)=e" on the interval (0,4) Da 3725 Ob 490 OC 745 Od 186 25
A:
Q: A metal plate was found submerged vertically in sea water,which has density 64 lb/ cu. ft .…
A:
Q: A 5-lb rope is 10-ft long and hangs down from a 20-ft-tall building. A 4-lb weight is attached to…
A:
Q: Cycling The Reynolds RZR 46 carbon wheel, which has a diameter of 700 millime-ters, has 16 spokes…
A: Diameter of wheel=700 mm Radius=diameter2=7002 mm=350 mm There are 16 spokes which are evenly…
Q: To measure seed properties, a 134 ml sample was randomly taken. The weight of the sample was 06.1…
A: Given that to measure seed properties, a 134 ml sample was randomly taken. The weight of the sample…
Q: J ů the positine dinecter Find
A: To Determine:- The integral ∫z = 1 z3 cos 1z dz , in the positive direction.
Q: 10. The tensile strengths of stainless steel cables of different diameters are investigated to give…
A: Introduction: An algebraic declaration with one or greater phrases is known as a polynomial. A…
Q: A vertical solid steel post of diameter ddd = 22 cmcm and length LLL = 3.00 mm is required to…
A:
Q: For a SUMMer job, you were working in the quality control department for a COMPuter COMPany that…
A: a) The mean value for the variable ‘Day Shift’ is 8.1 and it is calculated by using Excel…
Q: Flexural strength is a measure of a material's ability to resist failure in bending. The…
A: The 27 given values are 5.6, 7.2, 7.3, 6.3, 8.1, 6.8, 7.0, 7.6, 6.8, 6.5, 7.0, 6.3, 7.9, 9.0, 8.2,…
Q: trength is a measure of a material's ability to resist failure in bending. The accompanying data are…
A: Observe the given data on flexural strength of concrete (in MegaPascal, MPa).
Q: The linear density p in a rod 7 m long is 8/ sqrt(x+9) kg/m, where x is measured in meters from one…
A:
Q: Which of the following are not considered Gestalt principles of visual perception? O Proximity and…
A: Given problem Given that Which of the following are not considered Gestalt principles of visual…
Q: Find the total population within a 3-km radius of the city center (located at the origin) assuming a…
A: Given :- Population density = 2000(x2+y2)-0.1 people per square kilometer To find:- Total…
Q: The width of an outer aireraft panel is uniformly distributed between 1.00 to 1.10 millimeters.…
A: Solution
Q: nachine has just been installed to produce pr ce layer. The quality control inspector randor The…
A: mean of sample mean =87.36 mean of range (R) = 1.3
Q: What is the average elastic modulus of nylon when the forces are low? Do not be surprised by the…
A:
Q: The width of an outer aircraft panel is uniformly distributed between 1.00 to 1.10 millimeters.…
A:
Q: The stem-leaf diagram below shows compressive strength of concrete cubes measured in (Kpa).…
A: Given: n=20 The median is obtained as below: Median=sizen+12th item=size20+12th item=size of 10.5th…
Q: Find the average value of the function f(p, 4, 0) = p over the solid ball p < 1.
A:
Q: Flexural strength Is a measure of a material's ability to resist failure in bending. The…
A: Note: As per my policy i can answer only three sub parts. kindly repost the remaining sub parts…
Q: Below is a set of data collected for the density of an unknown liquid. Determine the slope of the…
A: The following data is given: X (Volume) Y (Mass) 5.00 9.27 10.00 19.23 15.00 26.58 20.00…
Q: If r(t) = , find the j-component of its principal unit normal, N at t = 1/2. Answer:
A: Principal Normal vector
Q: a) For the 14-gauge wire, determine the 5-number summary of the tensile strength.
A: a. The provided data set for 14-gauge wire increasing order are…
Q: What would the height need to be for this curve to be a density curve? 8 10 11 12 13 14 15 16 17 18…
A:
Q: The width of an outer aircraft panel is uniformly distributed between 1.00 to 1.10 millimeters.…
A:
Q: 6. The radius of the ball is 0.8 inches. If the measurement of the radius is correct within 0.02…
A:
Q: The width of an outer aireraft panel is uniformly distributed between 1.00 to 1.10 millimeters.…
A:
Q: HM:For the following table represents the uni-axial compressive strength for 50 samples from Baghdad…
A: Given: Class Frequency 60 - 62 2 63 - 65 3 66 - 68 5 69 - 71 7 72 - 74 8 75 - 77 11…
Q: Ultrasound was used to gather the accompanying corrosion data on the thickness of the floor plate of…
A: Given data, 98,40,52,94,55,115,60,70,75,85,125,85,90,92,94,95,125,100,90
Q: Find the average value
A:
Q: 3. Find the volume of the oblique cone below. Round to 3 decimal places. 27.2 19.8 24.3
A:
Q: Flexural strength is a measure of a material's ability to resist failure in bending. The…
A: " Since you have posted a question with multiple sub-parts, we will solve the first three subparts…
Q: Calculate the total area (m2) of a cross section using Simpson's 1/3 Rule. Consider the following…
A:
Q: (3) How much work does it take to pump water out of the following tank? (Use technology to…
A: To find: The work done to pump water. Given information: The dimension of the triangular prism tank…
Q: and Car Crashes Using the listed lemon/crash data, find the best pred rate for a year in which there…
A: *Answer:
Q: Flexural strength is a measure of a material's ability to resist failure in bending. The…
A:
Mm7


Trending now
This is a popular solution!

Step by step
Solved in 4 steps with 1 images

- The article “Models for Assessing Hoisting Times of Tower Cranes” (A. Leung and C. Tam, Journal of Construction Engineering and Management, 1999: 385–391) presents a model constructed by a stepwise regression procedure to predict the time needed for a tower crane hoisting operation. Twenty variables were considered, and the stepwise procedure chose a nine-variable model. The adjusted R2 for the selected model was 0.73. True or false: a) The value 0.73 is a reliable measure of the goodness of fit of the selected model. b) The value 0.73 may exaggerate the goodness of fit of the model. c) A stepwise regression procedure selects only variables that are of some use in predicting the value of the dependent variable. d) It is possible for a variable that is of no use in predicting the value of a dependent variable to be part of a model selected by a stepwise regression procedure.A random sample of 8 office staffs hired within the previous year was selected from a large corporation. For each selected office staff, his or her experience (in months) at the time of hire and starting salary were recorded. The data is given in the table below. Experience (in months) 13 6 8 10 20 7 9 15 Starting Salary (in thousand pesos) 20 14 16 19 21 12 13 21 Determine the following: regression equation sum of squares for error standard error coefficient of determinationUsing the regression line attached. Based on only the above plot, one can conclude: a) height causes an increase in weight b) weight causes an increase in height c) taller people are more likely to weigh more than shorter people, at least in the sample on which this data is based d) a statistically significant predictive relationship between height and weight e) c and d
- Following table shows the data of traffic density and accident ratio taken fromLahore Islamabad Motorway in the first quarter of 2018.Traffic Density X 30 35 40 45 50 60 70 80 90Accident Ratio Y 2 4 5 5 8 15 24 30 32a. Determine the equation for the estimated regression line of Y on Xb. Calculate the coefficient of determination.c. Find the product moment coefficient of correlationA research department of an American automobile company wants to develop a model topredict gasoline mileage (measured in MPG) of the company’s vehicles by using theirhorsepower and weights (measured in pounds). To do this, it took a random sample of 50vehicles to perform a regression analysis as follows: SUMMARYOUTPUTRegression StatisticsMultiple R 0.865689R Square 0.749417Adjusted RSquare 0.738754Standard Error 4.176602Observations 50ANOVAdf SS MS FRegression a 2451.973702 1225.987 dResidual b 819.8680976 cTotal 49 3271.8418CoefficientsStandardError t StatIntercept 58.15708 2.658248208 21.87797Horsepower -0.11753 0.032643428 -3.60028Weight -0.00687 0.001401173 -4.90349(a) State the multiple regression equation. Interpret the meanings of the coefficients forhorsepower and weight.(b) Test the validity of this multiple regression equation at the significance level of 1%. Showyour reasoning.(c) The research department claims that the weight of the vehicle is negatively linearly related…A fast-food chain decided to carry out an experiment to assess the influence of advertising expenditure on sales. Different relative changes in advertising expenditure, compared to the previous year, were made in eight regions of the country, and resulting changes in sales levels were observed the accompanying table shows the results. Increase in advertising expenditure (%) 0 5 15 20 25 30 35 40 Increase in sales (%) 5 10 18 25 35 50 60 65 Determine the value of regressions coefficients and write down the simple linear regression model.
- Give the data: Y. 12,14, 15, 17,18, 15,16 X1. 8,8,6,5,3, 4,7 X2. 0,1,1,2, 3,3,4 Obtain the least square estimates of the parameters in the multiple regression model and test the over all significance using Anova.A car dealership would like to develop a regression model that would predict the number of cars sold per month by a dealership employee based on theemployee's number of years of sales experience. The accompanying regression output was developed based on a random sample of employees. ANOVA df SS Regression 1 79.909407 Residual 23 261.210593 Total 24 341.12 Coefficients Standard Error Intercept 7.271539 1.229763 Slope 0.539854 1. Predict the sales next month for an employee with 2.5 years of experience. The predicted sales is 8.6 cars. 2. Compute the coefficient of determination and interpret its meaning. The coefficient of determination is 0.234. 3. Do the sample data provide evidence that the model is useful for predicting average monthly sales for employees based on their sales experience using α=0.05? The test statistic is (Type an integer or decimal rounded to two decimal places as…Given the table below, Let y, x1, x2, and x3 be the time of concentration (t, in hr), watershed length (L in ft), watershed slope (S in %), and runoff curve number (CN): Evaluate the linear multiple regression model with two or three predictor variables. Compute the multiple correlation coefficient, the standard error of estimate, and the standard deviation of the variable y. Discuss the reliability of the model
- A car dealership would like to develop a regression model that would predict the number of cars sold per month by a dealership employee based on theemployee's number of years of sales experience. The accompanying regression output was developed based on a random sample of employees. ANOVA df SS Regression 1 79.909407 Residual 23 261.210593 Total 24 341.12 Coefficients Standard Error Intercept 7.271539 1.229763 Slope 0.539854 0.203521 The coefficient of determination is 0.234 Test statistic= 0.704 P-value= 0.014 Construct a 95% confidence interval around the sample slope and interpret its meaning. The confidence interval is (__________,_________). (Type an integer or decimal rounded to three decimal places as needed.)A researcher wants to forecast the annual sales of Walmart, based on store size. To examine the relationship between the store size in square feet and its annual sales in million dollars, a sample of 14 stores was selected shown below in the image: Answer the following: i) Null hypothesis of correlation ii) Coefficient of Correlation and its interpretation iii) Interpret the sig value of ANOVA. iv) Coefficient of Determination and its interpretation v) Write down the Regression Model. vi) Interpret the value of ‘a’ vii) Interpret the value of ‘slope’Here is a bivariate data set. Find the regression equation for the response variable y. x y 60.9 36.2 55.8 44.3 27.8 61.7 36.1 56.3 56 53.7 49.8 55.2 45.7 51.5 60.1 46.6 63.1 50 63.9 40.2 68.8 45.4 32.3 60.4 76.6 40.6 65.4 46 65.6 42.7 regression equation: Enter the equation in slope-intercept form with parameters accurate to three decimal places.
