The table below represents the cumulative rainfall rate during 100 minutes. The initial rain storm losses were 0.6 cm and the indicator value was 0 = 0.6 cm/hour. Calculate: That is the sum of the total losses. b- The total surface runoff through this slope. 100 80 60 20 0 time (minutes) 3.5 0 Cumulative rain (cm) 3.3 2.6 40 1.2 0.5
The table below represents the cumulative rainfall rate during 100 minutes. The initial rain storm losses were 0.6 cm and the indicator value was 0 = 0.6 cm/hour. Calculate: That is the sum of the total losses. b- The total surface runoff through this slope. 100 80 60 20 0 time (minutes) 3.5 0 Cumulative rain (cm) 3.3 2.6 40 1.2 0.5

Traffic and Highway Engineering
5th Edition
ISBN:9781305156241
Author:Garber, Nicholas J.
Publisher:Garber, Nicholas J.
Chapter16: Highway Drainage
Section: Chapter Questions
Problem 9P

Related questions

Question
Transcribed Image Text:Q2:
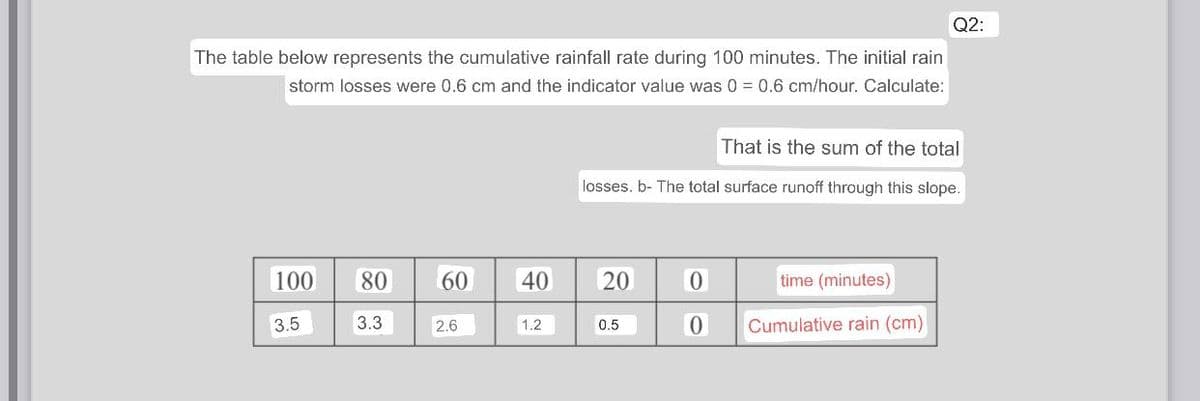
The table below represents the cumulative rainfall rate during 100 minutes. The initial rain
storm losses were 0.6 cm and the indicator value was 0 = 0.6 cm/hour. Calculate:
That is the sum of the total
losses. b- The total surface runoff through this slope.
100
80
60
20
0
time (minutes)
3.5
0
Cumulative rain (cm)
3.3
2.6
40
1.2
0.5
Expert Solution
This question has been solved!
Explore an expertly crafted, step-by-step solution for a thorough understanding of key concepts.

Step by step
Solved in 3 steps

Knowledge Booster


Learn more about
Need a deep-dive on the concept behind this application? Look no further. Learn more about this topic, civil-engineering and related others by exploring similar questions and additional content below.Recommended textbooks for you
Traffic and Highway Engineering
Civil Engineering
ISBN:
9781305156241
Author:
Garber, Nicholas J.
Publisher:
Cengage Learning
Traffic and Highway Engineering
Civil Engineering
ISBN:
9781305156241
Author:
Garber, Nicholas J.
Publisher:
Cengage Learning