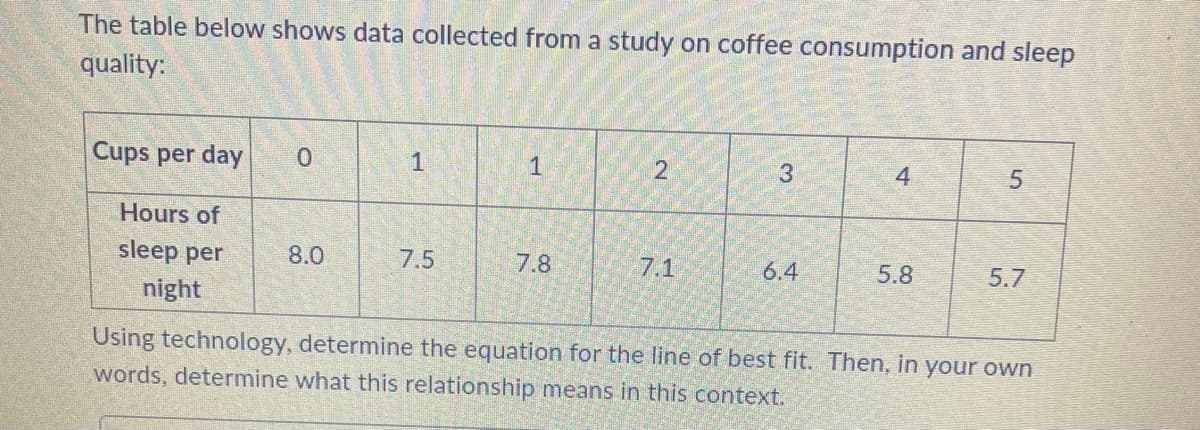
The table below shows data collected from a study on coffee consumption and sleep quality: Cups per day 0 1 1 2 3 4 5 Hours of sleep per night 8.0 7.5 7.8 7.1 6.4 5.8 5.7 Using technology, determine the equation for the line of best fit. Then, in your own words, determine what this relationship means in this context.
The table below shows data collected from a study on coffee consumption and sleep quality: Cups per day 0 1 1 2 3 4 5 Hours of sleep per night 8.0 7.5 7.8 7.1 6.4 5.8 5.7 Using technology, determine the equation for the line of best fit. Then, in your own words, determine what this relationship means in this context.

Chapter3: Polynomial Functions
Section3.5: Mathematical Modeling And Variation
Problem 1ECP: The ordered pairs below give the median sales prices y (in thousands of dollars) of new homes sold...

Related questions
Question
100%
Transcribed Image Text:The table below shows data collected from a study on coffee consumption and sleep
quality:
Cups per day
0
1
1
2
3
4
5
Hours of
sleep per
night
8.0
7.5
7.8
7.1
6.4
5.8
5.7
Using technology, determine the equation for the line of best fit. Then, in your own
words, determine what this relationship means in this context.
Expert Solution
This question has been solved!
Explore an expertly crafted, step-by-step solution for a thorough understanding of key concepts.

Step by step
Solved in 2 steps with 4 images

Recommended textbooks for you

Algebra & Trigonometry with Analytic Geometry
Algebra
ISBN:
9781133382119
Author:
Swokowski
Publisher:
Cengage

Functions and Change: A Modeling Approach to Coll…
Algebra
ISBN:
9781337111348
Author:
Bruce Crauder, Benny Evans, Alan Noell
Publisher:
Cengage Learning
Algebra & Trigonometry with Analytic Geometry
Algebra
ISBN:
9781133382119
Author:
Swokowski
Publisher:
Cengage
Functions and Change: A Modeling Approach to Coll…
Algebra
ISBN:
9781337111348
Author:
Bruce Crauder, Benny Evans, Alan Noell
Publisher:
Cengage Learning