The table below shows retail sales at drug stores in the United States in billions of dollars since 2000. Year Retail Sales 0 3 6 9 12 15 85.851 108.426 141.781 169.256 202.297 222.266 220 200- 180- 160- 140- 120 100 804 The graph shows a scatterplot of the data and the linear model y = 9.44x+84.182, where y is billions of dollars and is years since 2000. A) Is the line a good model for the data? The line is a good model for the data. The line is not a good model for the data 8 10 12 14 B) Use the graph of the model to estimate what retails sales were in 2011. billions of dollars C) Use the equation of the model to predict the year when retails sales will reach $249 billion.
The table below shows retail sales at drug stores in the United States in billions of dollars since 2000. Year Retail Sales 0 3 6 9 12 15 85.851 108.426 141.781 169.256 202.297 222.266 220 200- 180- 160- 140- 120 100 804 The graph shows a scatterplot of the data and the linear model y = 9.44x+84.182, where y is billions of dollars and is years since 2000. A) Is the line a good model for the data? The line is a good model for the data. The line is not a good model for the data 8 10 12 14 B) Use the graph of the model to estimate what retails sales were in 2011. billions of dollars C) Use the equation of the model to predict the year when retails sales will reach $249 billion.

Big Ideas Math A Bridge To Success Algebra 1: Student Edition 2015
1st Edition
ISBN:9781680331141
Author:HOUGHTON MIFFLIN HARCOURT
Publisher:HOUGHTON MIFFLIN HARCOURT
Chapter4: Writing Linear Equations
Section: Chapter Questions
Problem 9CA

Related questions
Question
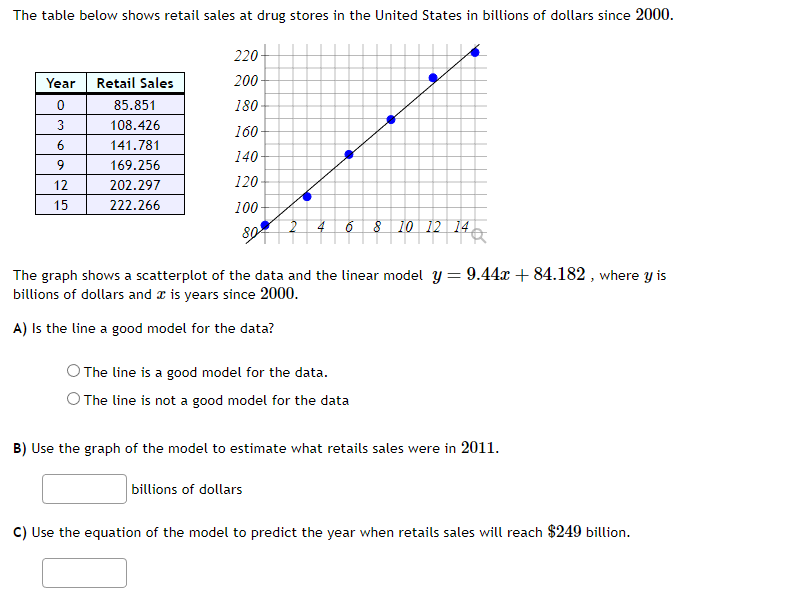
Transcribed Image Text:The table below shows retail sales at drug stores in the United States in billions of dollars since 2000.
Year Retail Sales
0
3
6
9
12
15
85.851
108.426
141.781
169.256
202.297
222.266
220
200-
180-
160-
140-
120
100
804
The graph shows a scatterplot of the data and the linear model y = 9.44x+84.182, where y is
billions of dollars and is years since 2000.
A) Is the line a good model for the data?
The line is a good model for the data.
The line is not a good model for the data
8 10 12 14
B) Use the graph of the model to estimate what retails sales were in 2011.
billions of dollars
C) Use the equation of the model to predict the year when retails sales will reach $249 billion.
Expert Solution
Step 1

Trending now
This is a popular solution!

Step by step
Solved in 2 steps with 2 images

Recommended textbooks for you
Big Ideas Math A Bridge To Success Algebra 1: Stu…
Algebra
ISBN:
9781680331141
Author:
HOUGHTON MIFFLIN HARCOURT
Publisher:
Houghton Mifflin Harcourt

Elementary Linear Algebra (MindTap Course List)
Algebra
ISBN:
9781305658004
Author:
Ron Larson
Publisher:
Cengage Learning

Big Ideas Math A Bridge To Success Algebra 1: Stu…
Algebra
ISBN:
9781680331141
Author:
HOUGHTON MIFFLIN HARCOURT
Publisher:
Houghton Mifflin Harcourt
Elementary Linear Algebra (MindTap Course List)
Algebra
ISBN:
9781305658004
Author:
Ron Larson
Publisher:
Cengage Learning

Functions and Change: A Modeling Approach to Coll…
Algebra
ISBN:
9781337111348
Author:
Bruce Crauder, Benny Evans, Alan Noell
Publisher:
Cengage Learning

Algebra & Trigonometry with Analytic Geometry
Algebra
ISBN:
9781133382119
Author:
Swokowski
Publisher:
Cengage