The table below shows the results of a survey on a new government policy. O O O O 19 82 67 164 Based on the data, what is the probability that a randomly selected woman who participated in the survey was against the new government policy? 38 89 Men Women 38 67 Survey Results For 37 43 Against 29 38 No Opinion 9 8
The table below shows the results of a survey on a new government policy. O O O O 19 82 67 164 Based on the data, what is the probability that a randomly selected woman who participated in the survey was against the new government policy? 38 89 Men Women 38 67 Survey Results For 37 43 Against 29 38 No Opinion 9 8

Chapter8: Sequences, Series,and Probability
Section8.7: Probability
Problem 4ECP: Show that the probability of drawing a club at random from a standard deck of 52 playing cards is...

Related questions
Question
100%
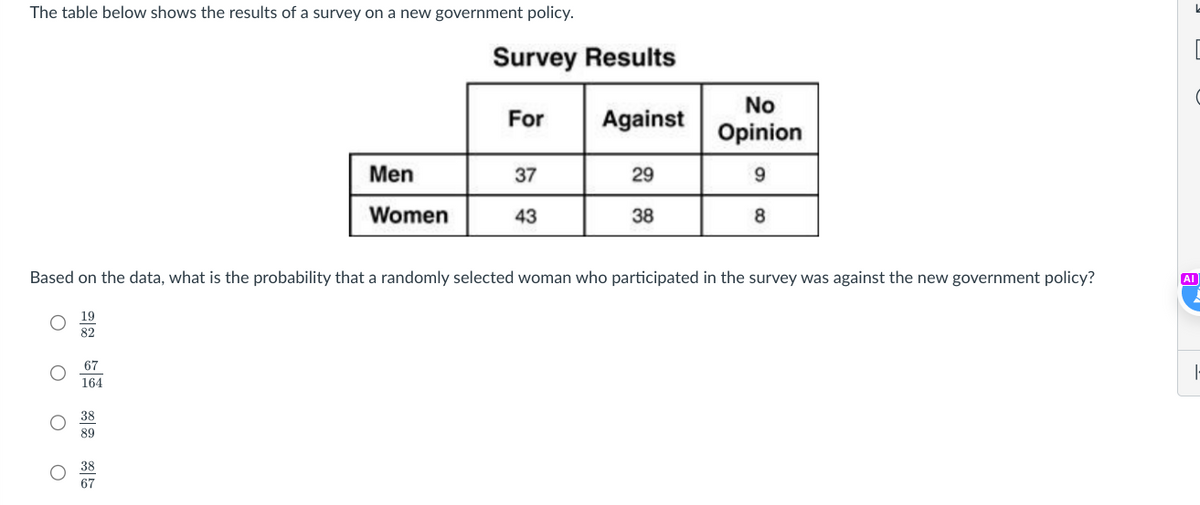
Transcribed Image Text:The table below shows the results of a survey on a new government policy.
O
O
O
19
82
67
164
Men
Women
38
89
Survey Results
For
Based on the data, what is the probability that a randomly selected woman who participated in the survey was against the new government policy?
37
43
Against
29
38
No
Opinion
9
8
[
C
AI
|-
Expert Solution
This question has been solved!
Explore an expertly crafted, step-by-step solution for a thorough understanding of key concepts.

This is a popular solution!

Trending now
This is a popular solution!

Step by step
Solved in 3 steps with 3 images

Recommended textbooks for you

Holt Mcdougal Larson Pre-algebra: Student Edition…
Algebra
ISBN:
9780547587776
Author:
HOLT MCDOUGAL
Publisher:
HOLT MCDOUGAL
Holt Mcdougal Larson Pre-algebra: Student Edition…
Algebra
ISBN:
9780547587776
Author:
HOLT MCDOUGAL
Publisher:
HOLT MCDOUGAL