The table describes four possible outcomes for 2017, depending on the level of aggregate demand in that year. Inflation rate (percent per year) 12 Potential GDP is $12 trillion and the natural unemployment rate is 5 percent. 11- 10- Price level (2016 = 100) Unemployment rate (percent of labor force) 9- 102.5 9. 8- B 105.0 7- C 107.5 4. 6- 110.0 5- Draw the four points A,B,C, and D on the short-run Phillips curve using the data in the table. Label the points. 4- 3- Draw the short-run Phillips curve through the points. Label it SRPC. 2- 1- empts 0- 4 10 Unemployment rate (percent of labor force) >>> Draw only the objects specified in the question. Selected: 1. Delete Clear none Time Remaining: 01:55:16 Next tact Us
The table describes four possible outcomes for 2017, depending on the level of aggregate demand in that year. Inflation rate (percent per year) 12 Potential GDP is $12 trillion and the natural unemployment rate is 5 percent. 11- 10- Price level (2016 = 100) Unemployment rate (percent of labor force) 9- 102.5 9. 8- B 105.0 7- C 107.5 4. 6- 110.0 5- Draw the four points A,B,C, and D on the short-run Phillips curve using the data in the table. Label the points. 4- 3- Draw the short-run Phillips curve through the points. Label it SRPC. 2- 1- empts 0- 4 10 Unemployment rate (percent of labor force) >>> Draw only the objects specified in the question. Selected: 1. Delete Clear none Time Remaining: 01:55:16 Next tact Us

Calculus: Early Transcendentals
8th Edition
ISBN:9781285741550
Author:James Stewart
Publisher:James Stewart
Chapter1: Functions And Models
Section: Chapter Questions
Problem 1RCC: (a) What is a function? What are its domain and range? (b) What is the graph of a function? (c) How...

Related questions
Question
Plz plz help now plz plz
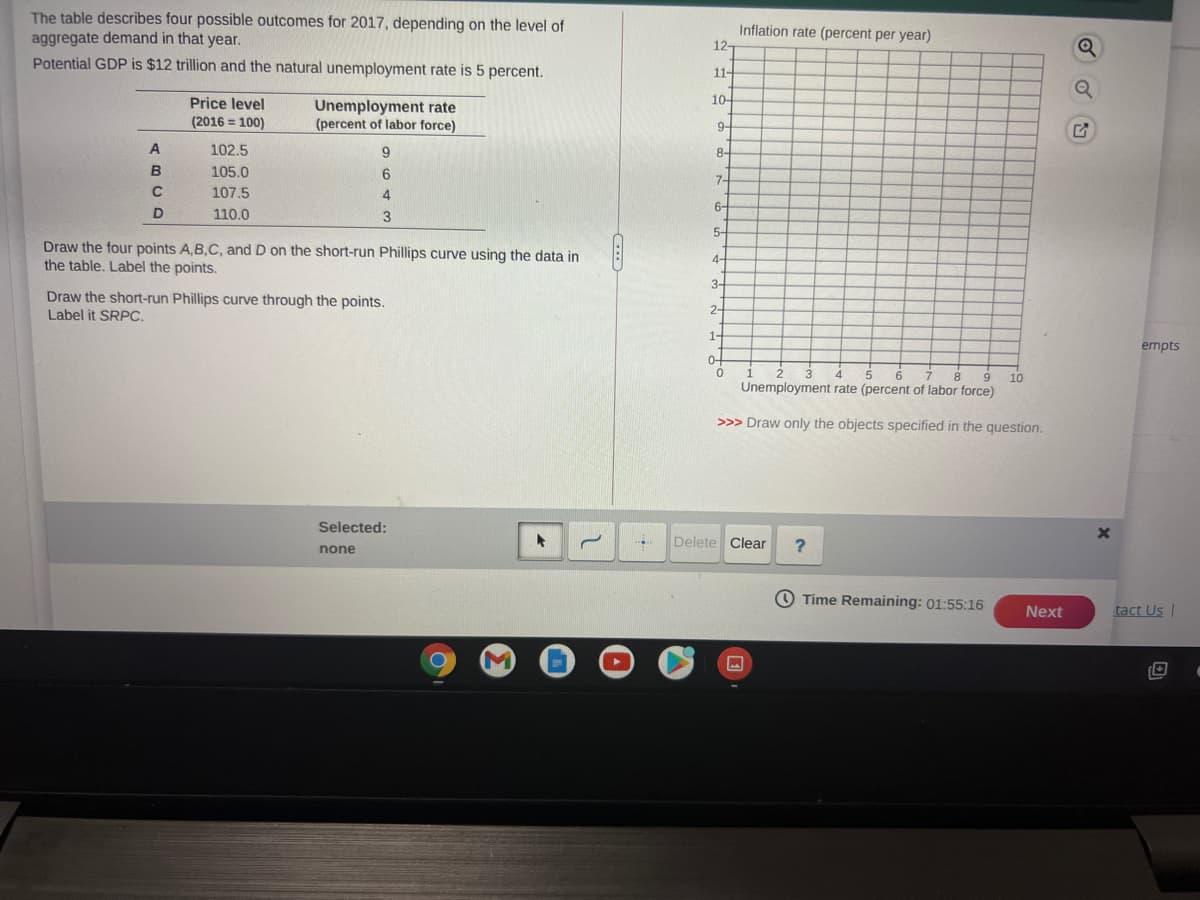
Transcribed Image Text:The table describes four possible outcomes for 2017, depending on the level of
aggregate demand in that year.
Potential GDP is $12 trillion and the natural unemployment rate is 5 percent.
Inflation rate (percent per year)
12-
11-
Price level
10-
Unemployment rate
(percent of labor force)
(2016 = 100)
9-
A
102.5
8-
105.0
6
7-
107.5
4.
6-
110.0
5-
Draw the four points A,B,C, and D on the short-run Phillips curve using the data in
the table. Label the points.
4-
3-
Draw the short-run Phillips curve through the points.
Label it SRPC.
2-
1-
empts
0-
10
Unemployment rate (percent of labor force)
>>> Draw only the objects specified in the question.
Selected:
Delete Clear
none
O Time Remaining: 01:55:16
Next
tact Us |
Expert Solution
This question has been solved!
Explore an expertly crafted, step-by-step solution for a thorough understanding of key concepts.

This is a popular solution!

Trending now
This is a popular solution!

Step by step
Solved in 3 steps with 3 images

Recommended textbooks for you
Calculus: Early Transcendentals
Calculus
ISBN:
9781285741550
Author:
James Stewart
Publisher:
Cengage Learning

Thomas' Calculus (14th Edition)
Calculus
ISBN:
9780134438986
Author:
Joel R. Hass, Christopher E. Heil, Maurice D. Weir
Publisher:
PEARSON

Calculus: Early Transcendentals (3rd Edition)
Calculus
ISBN:
9780134763644
Author:
William L. Briggs, Lyle Cochran, Bernard Gillett, Eric Schulz
Publisher:
PEARSON
Calculus: Early Transcendentals
Calculus
ISBN:
9781285741550
Author:
James Stewart
Publisher:
Cengage Learning
Thomas' Calculus (14th Edition)
Calculus
ISBN:
9780134438986
Author:
Joel R. Hass, Christopher E. Heil, Maurice D. Weir
Publisher:
PEARSON
Calculus: Early Transcendentals (3rd Edition)
Calculus
ISBN:
9780134763644
Author:
William L. Briggs, Lyle Cochran, Bernard Gillett, Eric Schulz
Publisher:
PEARSON

Calculus: Early Transcendentals
Calculus
ISBN:
9781319050740
Author:
Jon Rogawski, Colin Adams, Robert Franzosa
Publisher:
W. H. Freeman


Calculus: Early Transcendental Functions
Calculus
ISBN:
9781337552516
Author:
Ron Larson, Bruce H. Edwards
Publisher:
Cengage Learning