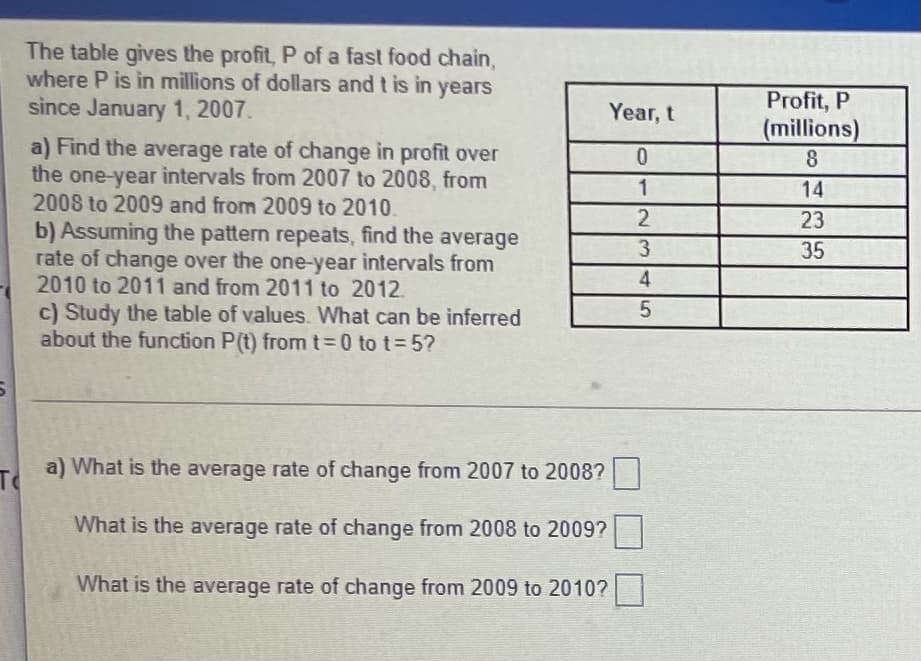
The table gives the profit, P of a fast food chain, where P is in millions of dollars and t is in years since January 1, 2007. Profit, P (millions) 8. Year, t a) Find the average rate of change in profit over the one-year intervals from 2007 to 2008, from 2008 to 2009 and from 2009 to 2010. 1 14 2 23 b) Assuming the pattern repeats, find the average rate of change over the one-year intervals from 2010 to 2011 and from 2011 to 2012. c) Study the table of values. What can be inferred about the function P(t) fromt3D0 to t 5? 35 4 To a) What is the average rate of change from 2007 to 2008? What is the average rate of change from 2008 to 2009? What is the average rate of change from 2009 to 2010?
The table gives the profit, P of a fast food chain, where P is in millions of dollars and t is in years since January 1, 2007. Profit, P (millions) 8. Year, t a) Find the average rate of change in profit over the one-year intervals from 2007 to 2008, from 2008 to 2009 and from 2009 to 2010. 1 14 2 23 b) Assuming the pattern repeats, find the average rate of change over the one-year intervals from 2010 to 2011 and from 2011 to 2012. c) Study the table of values. What can be inferred about the function P(t) fromt3D0 to t 5? 35 4 To a) What is the average rate of change from 2007 to 2008? What is the average rate of change from 2008 to 2009? What is the average rate of change from 2009 to 2010?

Big Ideas Math A Bridge To Success Algebra 1: Student Edition 2015
1st Edition
ISBN:9781680331141
Author:HOUGHTON MIFFLIN HARCOURT
Publisher:HOUGHTON MIFFLIN HARCOURT
Chapter8: Graphing Quadratic Functions
Section: Chapter Questions
Problem 30CR

Related questions
Question
13
Transcribed Image Text:The table gives the profit, P of a fast food chain,
where P is in millions of dollars and t is in years
since January 1, 2007.
Profit, P
(millions)
8.
Year, t
a) Find the average rate of change in profit over
the one-year intervals from 2007 to 2008, from
2008 to 2009 and from 2009 to 2010.
0.
1
14
2
23
b) Assuming the pattern repeats, find the average
rate of change over the one-year intervals from
2010 to 2011 and from 2011 to 2012.
c) Study the table of values. What can be inferred
about the function P(t) fromt3D0 to t 5?
35
To
T a) What is the average rate of change from 2007 to 2008?
What is the average rate of change from 2008 to 2009?
What is the average rate of change from 2009 to 2010?
Expert Solution
This question has been solved!
Explore an expertly crafted, step-by-step solution for a thorough understanding of key concepts.

This is a popular solution!

Trending now
This is a popular solution!

Step by step
Solved in 4 steps with 1 images

Recommended textbooks for you
Big Ideas Math A Bridge To Success Algebra 1: Stu…
Algebra
ISBN:
9781680331141
Author:
HOUGHTON MIFFLIN HARCOURT
Publisher:
Houghton Mifflin Harcourt


Trigonometry (MindTap Course List)
Trigonometry
ISBN:
9781337278461
Author:
Ron Larson
Publisher:
Cengage Learning
Big Ideas Math A Bridge To Success Algebra 1: Stu…
Algebra
ISBN:
9781680331141
Author:
HOUGHTON MIFFLIN HARCOURT
Publisher:
Houghton Mifflin Harcourt
Trigonometry (MindTap Course List)
Trigonometry
ISBN:
9781337278461
Author:
Ron Larson
Publisher:
Cengage Learning

Functions and Change: A Modeling Approach to Coll…
Algebra
ISBN:
9781337111348
Author:
Bruce Crauder, Benny Evans, Alan Noell
Publisher:
Cengage Learning

Algebra & Trigonometry with Analytic Geometry
Algebra
ISBN:
9781133382119
Author:
Swokowski
Publisher:
Cengage

College Algebra
Algebra
ISBN:
9781305115545
Author:
James Stewart, Lothar Redlin, Saleem Watson
Publisher:
Cengage Learning