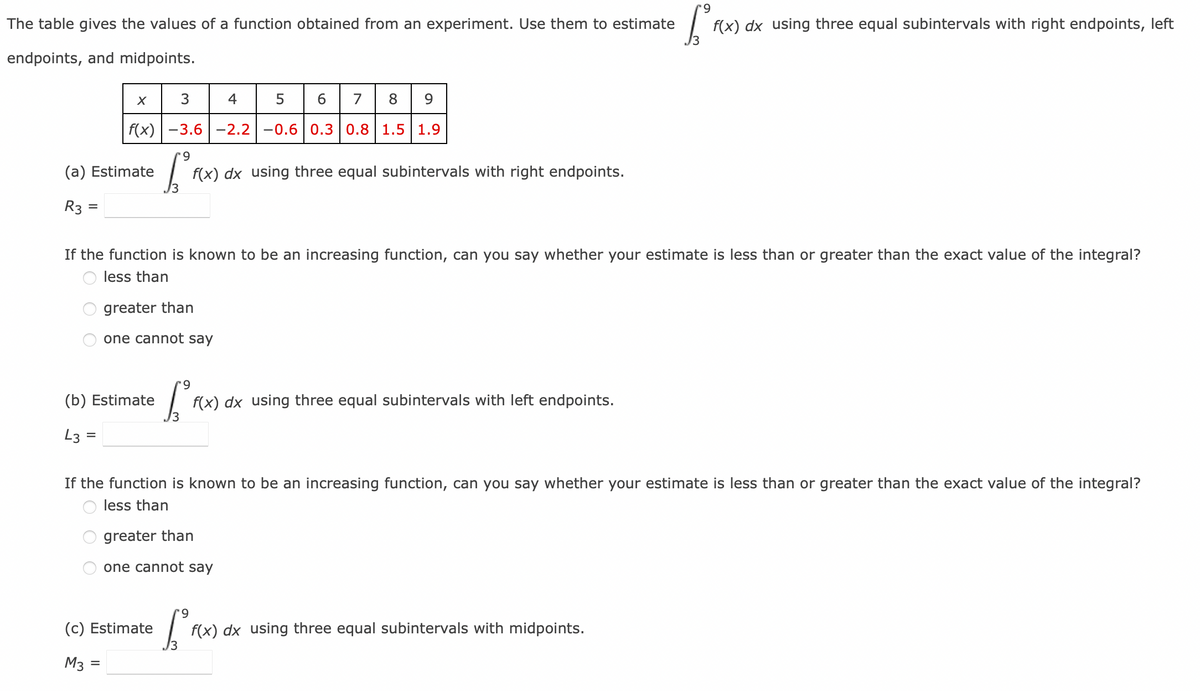
The table gives the values of a function obtained from an experiment. Use them to estimate f(x) dx using three equal subintervals with right endpoints, left endpoints, and midpoints. 3 4 5 6 7 8 f(x) -3.6| -2.2 -0.6 0.3 0.8 1.5 1.9 (a) Estimate f(x) dx using three equal subintervals with right endpoints. R3 = If the function is known to be an increasing function, can you say whether your estimate is less than or greater than the exact value of the integral? O less than greater than one cannot say (b) Estimate f(x) dx using three equal subintervals with left endpoints. L3 = If the function is known to be an increasing function, can you say whether your estimate is less than or greater than the exact value of the integral? less than O greater than O one cannot say (c) Estimate f(x) dx using three equal subintervals with midpoints. M3 =


Continuous Probability Distributions
Probability distributions are of two types, which are continuous probability distributions and discrete probability distributions. A continuous probability distribution contains an infinite number of values. For example, if time is infinite: you could count from 0 to a trillion seconds, billion seconds, so on indefinitely. A discrete probability distribution consists of only a countable set of possible values.
Normal Distribution
Suppose we had to design a bathroom weighing scale, how would we decide what should be the range of the weighing machine? Would we take the highest recorded human weight in history and use that as the upper limit for our weighing scale? This may not be a great idea as the sensitivity of the scale would get reduced if the range is too large. At the same time, if we keep the upper limit too low, it may not be usable for a large percentage of the population!


Trending now
This is a popular solution!

Step by step
Solved in 3 steps


