The table shows a function. Is the function linear or nonlinear? X y 3

Algebra & Trigonometry with Analytic Geometry
13th Edition
ISBN:9781133382119
Author:Swokowski
Publisher:Swokowski
Chapter7: Analytic Trigonometry
Section7.6: The Inverse Trigonometric Functions
Problem 93E

Related questions

Concept explainers
Equations and Inequations
Equations and inequalities describe the relationship between two mathematical expressions.
Linear Functions
A linear function can just be a constant, or it can be the constant multiplied with the variable like x or y. If the variables are of the form, x2, x1/2 or y2 it is not linear. The exponent over the variables should always be 1.
Question
Transcribed Image Text:near fuletions fror X
A ixl.com/math/algebra-1/identify-linear-functions-from-tables
Acellus - The Scienc. M My Gmail
AMy Classes
eo K-. G Google
6 MathGrades K to 12
IXL
Search topics and skills
Learning
Diagnostic
Analytics
* Recommendations
1 Skill plans
Math
Algebra 1
> S.2 Identify linear functions from tables F5G
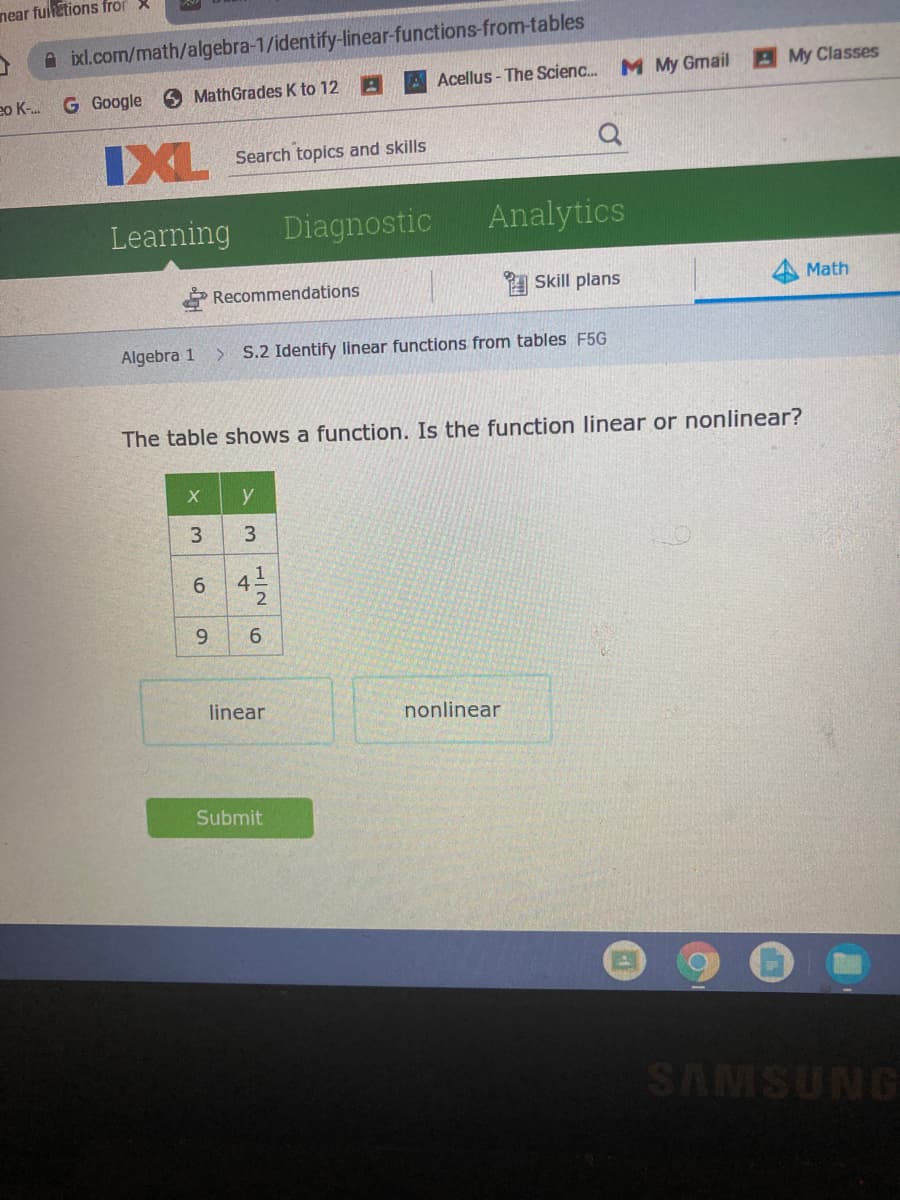
The table shows a function. Is the function linear or nonlinear?
y
3.
3
6 4
6.
linear
nonlinear
Submit
Expert Solution
This question has been solved!
Explore an expertly crafted, step-by-step solution for a thorough understanding of key concepts.

This is a popular solution!

Trending now
This is a popular solution!

Step by step
Solved in 3 steps

Knowledge Booster


Learn more about
Need a deep-dive on the concept behind this application? Look no further. Learn more about this topic, advanced-math and related others by exploring similar questions and additional content below.Recommended textbooks for you
Algebra & Trigonometry with Analytic Geometry
Algebra
ISBN:
9781133382119
Author:
Swokowski
Publisher:
Cengage

Algebra & Trigonometry with Analytic Geometry
Algebra
ISBN:
9781133382119
Author:
Swokowski
Publisher:
Cengage